Examining the Efficiency of TiO2 in Matt Paints
and Methods of Obtaining Optimal Dry Opacity Without Sacrificing Wet Hide

Titanium dioxide pigment (TiO2) has celebrated over 100 years of commercial manufacture, and for much of that time, it has been the primary white pigment, providing whiteness, brightness, and opacity to paint, coatings, plastics, inks, paper, and many other applications.
Titanium dioxide’s high refractive index, carefully controlled physical properties, and relative inertness (and lack of toxicity), make it the first choice when light scattering is required; although many see TiO2 as a “necessary evil,” and a costly formulation ingredient.
In particular, where the highest levels of wet opacity are desired, TiO₂ outperforms all other pigments and extenders.
Light scattering is directly influenced by the refractive index of the different phases through which light passes. In essence, the bigger the difference between the refractive index of the pigment/extender, and the medium in which it is enclosed, the greater the scattering of the light.
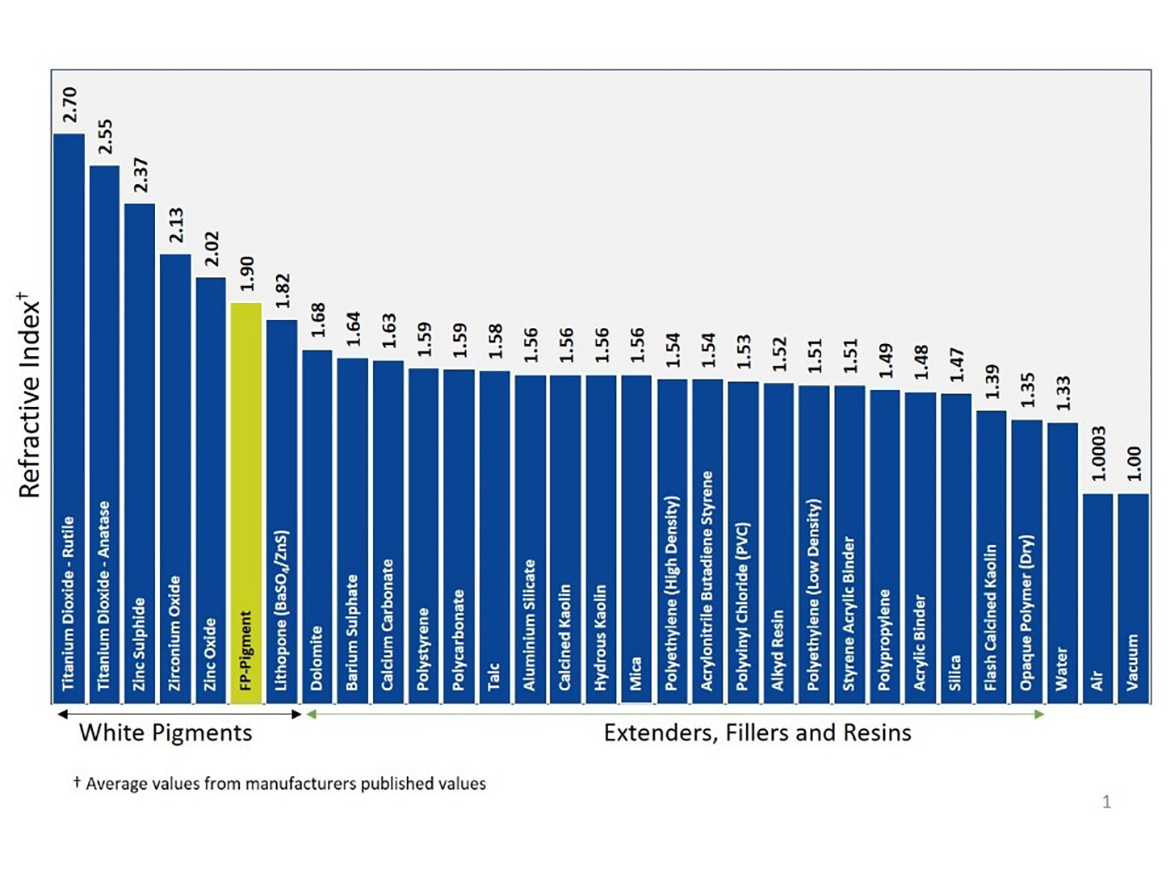
According to Figure 1, rutile TiO₂ has, by far, the highest refractive index, creating a difference between it and an acrylic binder of 1.22 units (2.70–1.48). Compare this with the typical extender where the difference is 0.08 (1.56–1.48), and you can see why TiO₂ is so important.
Comparing the Wet Hide Performance of TiO₂ and Extenders
It is well understood that TiO₂ provides the best performance when wet hide is required. To evaluate how much higher the performance of TiO₂ is compared with some typical extenders, we developed a simple but reproducible test method to allow reasonably accurate (±0.5 units of Rb) measurements of wet hide.
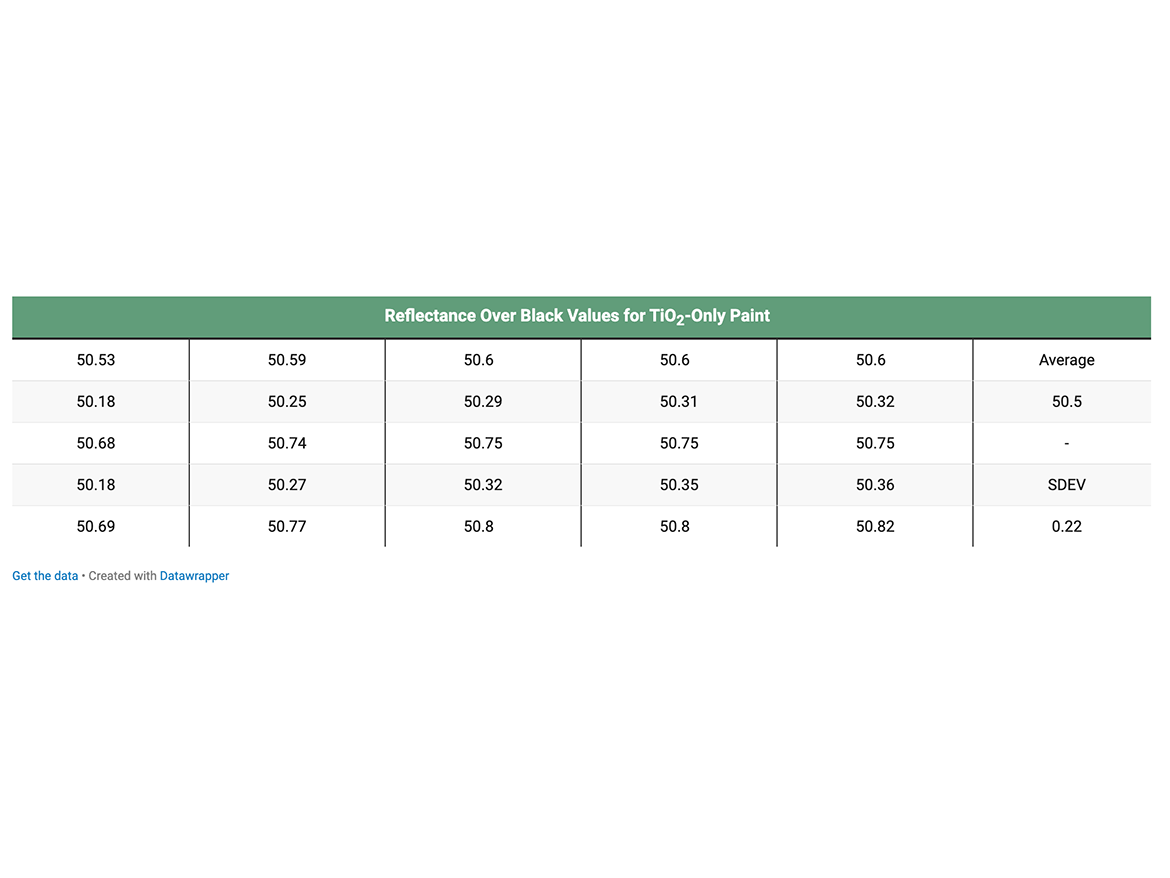
This simple evaluation involves measuring the reflectance values for five areas over the black part of a drawdown panel; the values are all recorded within a given, short time interval, and the process is repeated using three to five drawdown panels. This gives between 15 and 25 measured values, which are averaged, and the standard deviation calculated.
Table 1 shows an example of the values achieved for the wet hide of TiO₂ using this method on a 25%-PVC (TiO₂-only) paint.
The same test paint, using only one pigment/extender, was also made using a variety of common extender types.
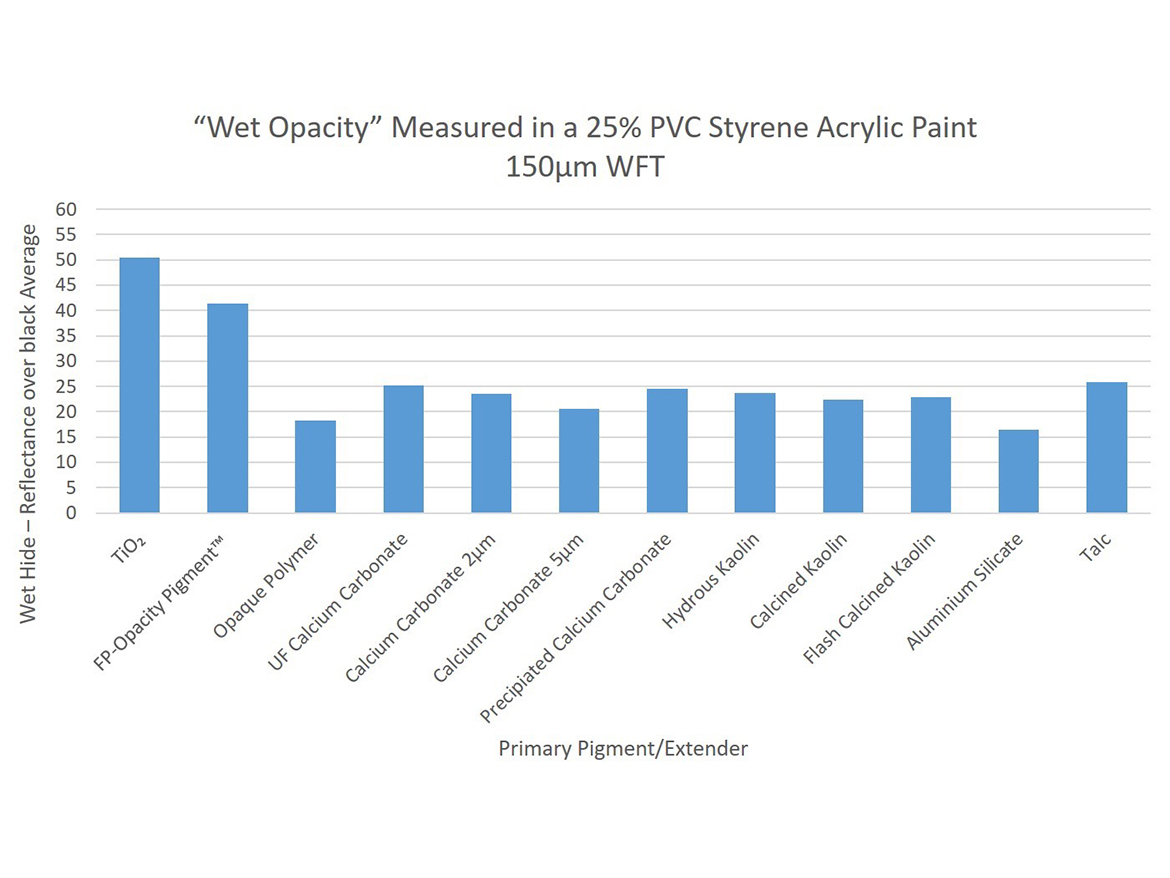
Figure 2 shows the significant performance advantage that TiO₂ has in generating wet hide, compared to typical extenders. The chart also shows that the small differences in refractive index between the different extender types has little effect on the wet hide generated.
In more realistic paint formulations, the presence of TiO₂ also dominates the wet opacity, the extenders and additives adding only slightly to the overall performance. Any attempt to significantly reduce the TiO₂, say by 10% or more, will lead to a drop in wet hide. With a 10% reduction in TiO₂ the wet hide is typically down, although it can be visually very similar to the standard. Using the wet hide method developed above, the differences can be measured and compared to the visual assessment.

Figure 3 shows photographs of wet drawdowns comparing the wet hide of a standard paint vs. the test paint with a percentage of TiO₂ replaced by CaCO₃.
For the 10% replacement, the wet hide is visibly down, but only just, and may be acceptable to the producer. The 15% replacement produces an obvious drop in wet hide that would be easily observed.
The visual appearance can be compared to the measured values of wet hide, and Figure 4 shows the performance of several extender types at two replacement levels.
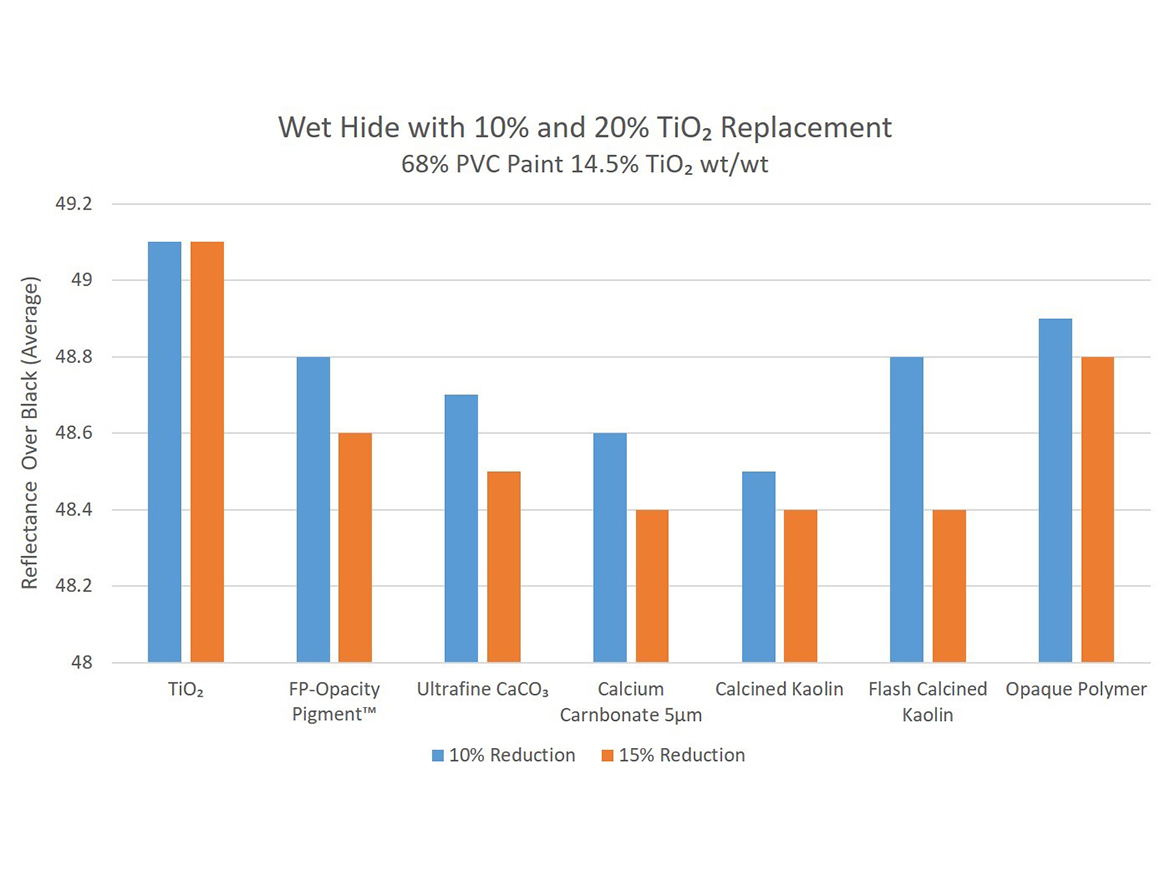
When measured, the differences between the replacement products become more apparent, and show performance levels that are not clearly visible. Replacing the TiO₂ has an obvious impact on wet hide, and the differences in refractive index of the extenders only plays a small part in negating this.
TiO2 Dispersion in Wet and Dry Films
In addition to the high refractive index, the dispersion and distribution of TiO₂ in the film plays a significant part in the story of wet and dry opacity. In the wet film, the TiO₂ is usually well dispersed and distributed. There is more than sufficient free volume (water) for the TiO₂ to be at, or close to, the ideal dispersion and most paints achieve this. As the paint dries and the aqueous phase evaporates, however, several things happen that impact the dispersion and distribution of the TiO₂ in the film.
TiO₂ Flocculation Due to Reduction in Electrostatic Repulsion
Figure 5 shows a simplified example of what happens with the TiO₂ dispersion in water-based paints. In the wet coating, the TiO₂ maintains a good wet hide as it is usually well dispersed and distributed in the wet film. However, as the film dries it loses the electrostatic stability and flocculates, leading to a reduction in scattering performance of the TiO₂. If the level of TiO₂ flocculation can be reduced or the “spacing” of the TiO₂ improved, then the coating opacity will also increase. Traditionally this is where the art of the formulator and their choice of raw materials (extenders, dispersants, emulsions, etc.) play a large part in optimizing the paint film for cost-effective opacity. It should, of course, be remembered that boosting the dry opacity in order to allow a reduction in the TiO₂ content will ultimately have a negative impact on the wet hide of the paint.

Spacing and Crowding of TiO₂ by Emulsion and Extenders
In order for TiO₂ pigment to provide the optimum scatter, the individual particles need to be correctly spaced from one another. Over the 100 years or so of TiO₂ production, the manufacturers have optimized the size and shape of TiO₂ to provide the highest scattering power, but it still requires good formulation to ensure the most optimal spacing of the TiO₂ can occur. In order to achieve the best scattering, the TiO₂ particles need to be kept approximately 280 nm apart. At this distance, light entering the film will “see” each individual 300 nm particle of TiO₂, and be subjected to the maximum degree of scatter. If the particles are closer than ~280 nm, the light will “see” the TiO₂ as a larger particle, rather than two discrete particles, and the scatter per unit TiO₂ will decrease.
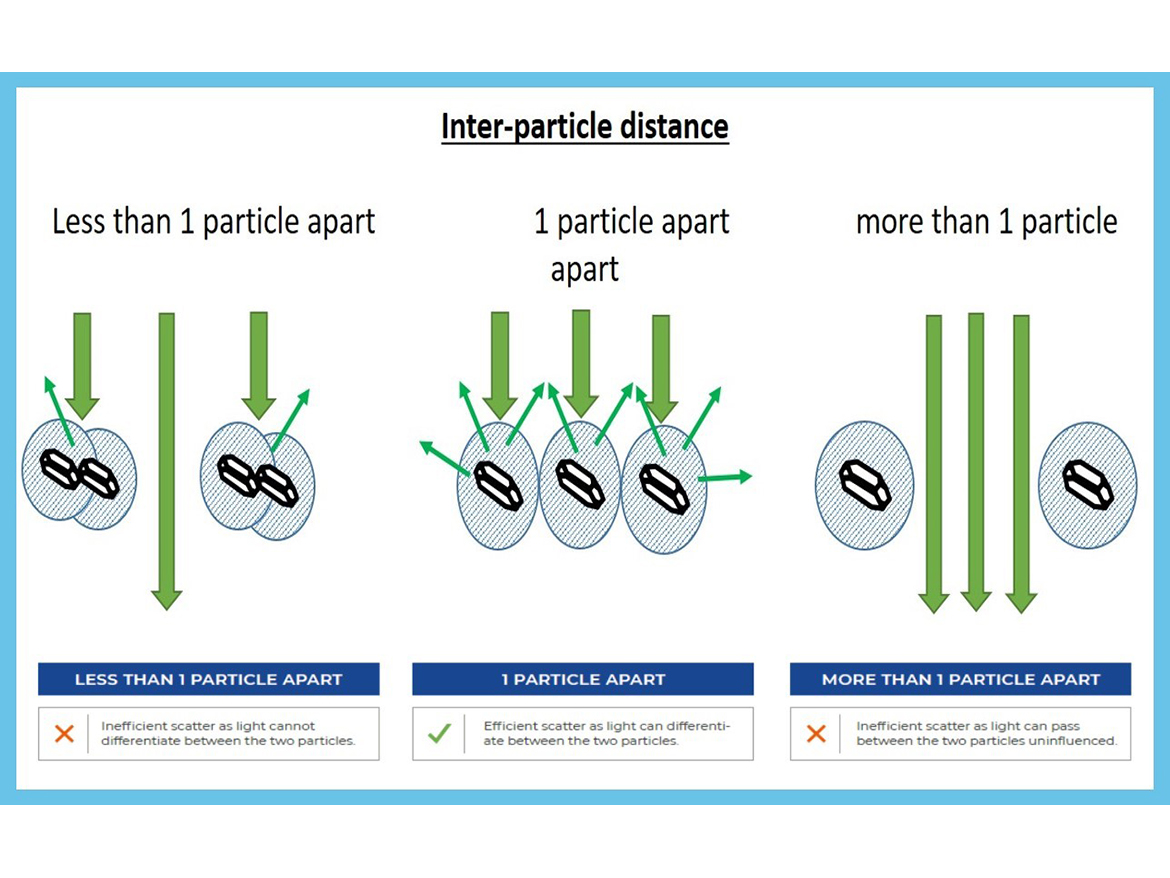
If the particles are closer than ~280 nm, the light will “see” the TiO₂ as a larger particle, rather than two discrete particles, and the scatter per unit TiO₂ will decrease. If the particles are over-spaced then the light will pass through the “window” and not be scattered. Figure 6 shows a schematic of these effects. Note, this is a somewhat simplistic representation as light, of course, is composed of more than one wavelength in the visible spectrum and each wavelength will be affected by the degree of spacing, but for the purposes of explaining scatter and opacity this description works well and is frequently used.
In a matt coating, the TiO₂ is used in conjunction with dispersants, extenders, fillers, and emulsions, each of which can have an impact on the spacing of the TiO₂. Clearly, from the requirement of Figure 6, any material larger than 300 nm will not truly space TiO₂, and there are few additives that come close to the optimum size. Extenders and fillers larger than 300 nm will simply create “windows” in the film through which light can pass without significant scattering.1 Emulsion droplets larger than 300 nm can have a similar effect, however, typical emulsions produced today have average droplet sizes well below 300 nm, with 50 to 150 nm being common. At these sizes the emulsion can help to ensure better spacing, but like ultrafine extenders, the interaction of these small particles is totally random. Figure 7 gives an idealized schematic showing how the fine extender sits between two TiO₂ particles, but there is no physical reason, in most cases, why this should be, and it is more common to see homoflocculates of TiO₂ and extender.2
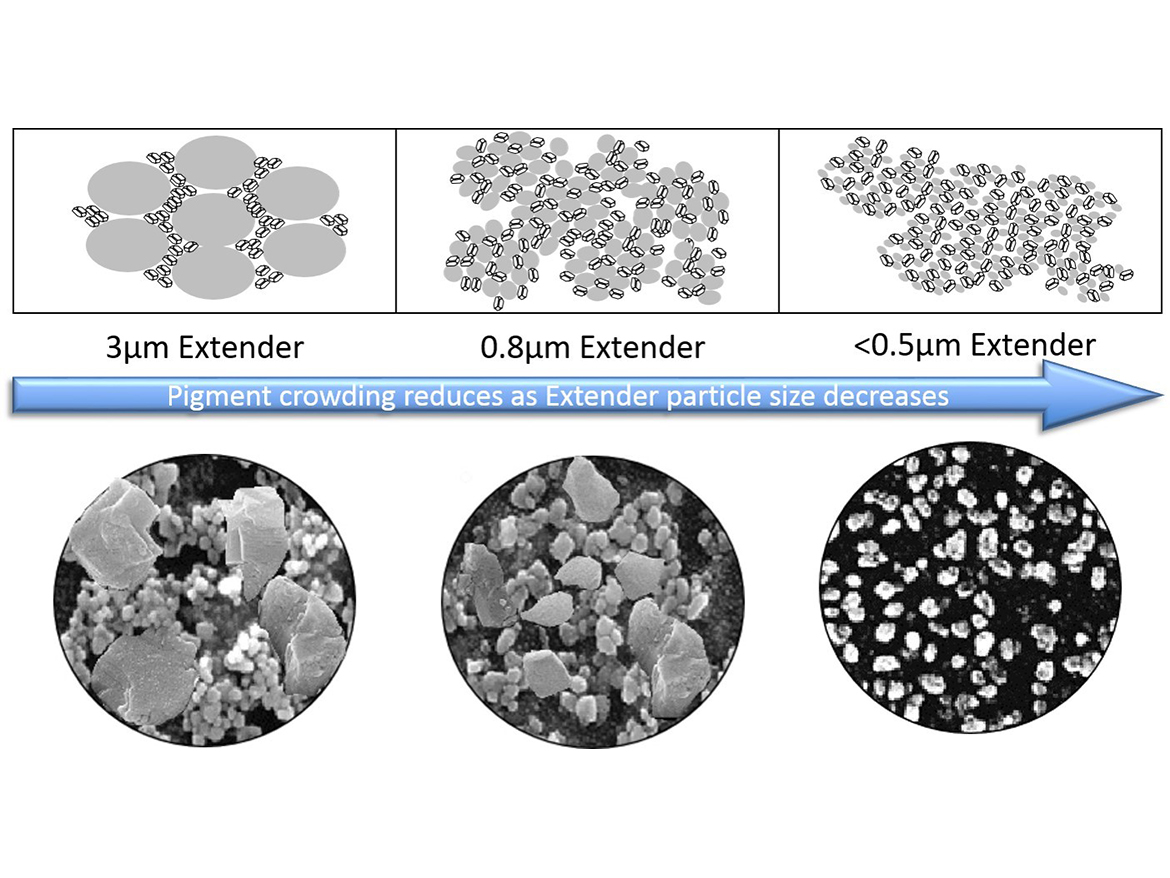
In Figure 7 the TiO₂ is flocculated, and these flocculates are crowded by the large extenders. Reducing the average size of the extender helps to reduce the crowding and improve the distribution of the TiO₂, but does not prevent the flocculation, i.e. it does not necessarily improve spacing.
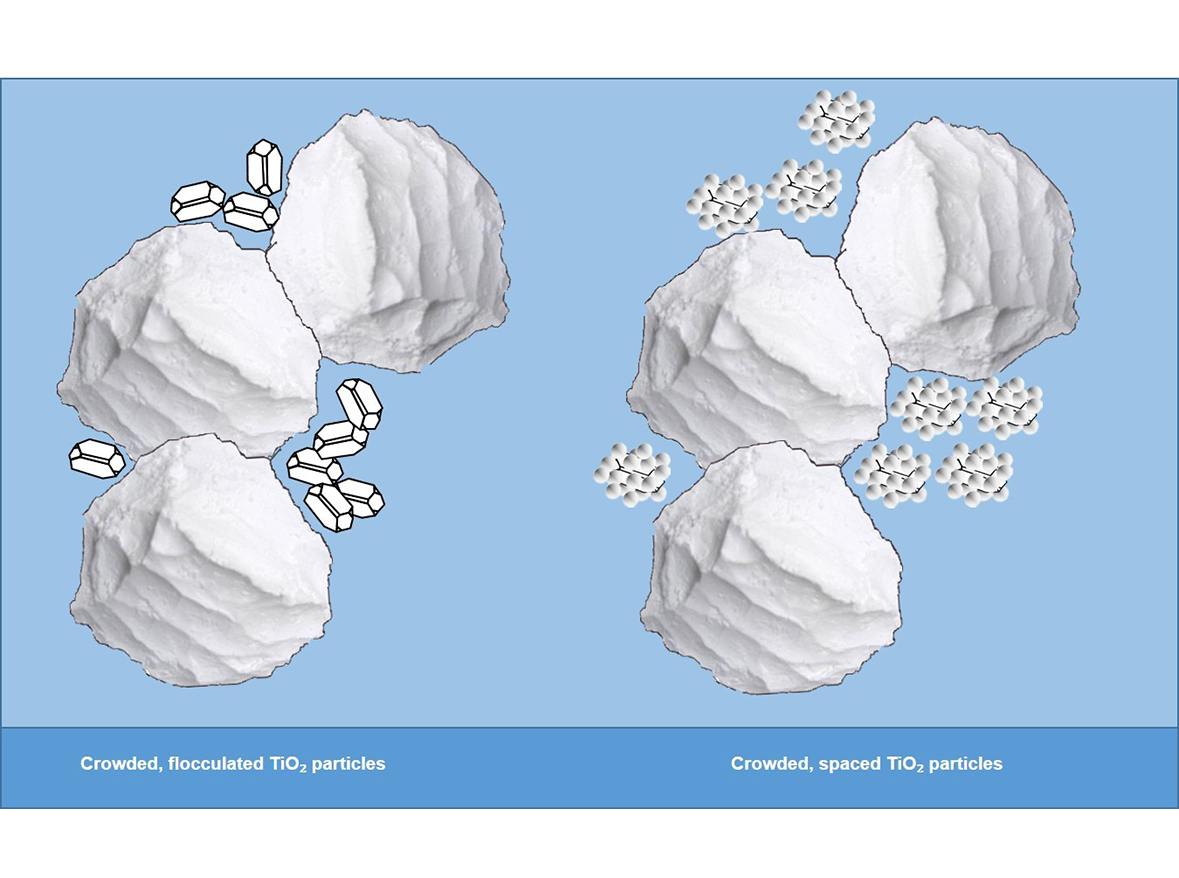
It should also be noted that the crowding effect of extenders could also be applied to spaced TiO₂. That is, even if the TiO₂ is physically spaced, those spaced particles can then be crowded and poorly distributed through the film because of the size of the extender particles.
For example, in Figure 8, the TiO₂ has been spaced by using a reactive polymer.3 These TiO₂/polymer composites will improve the scatter of the TiO₂ compared to flocculated TiO₂, but this improvement can be reduced if the composites are not evenly distributed.
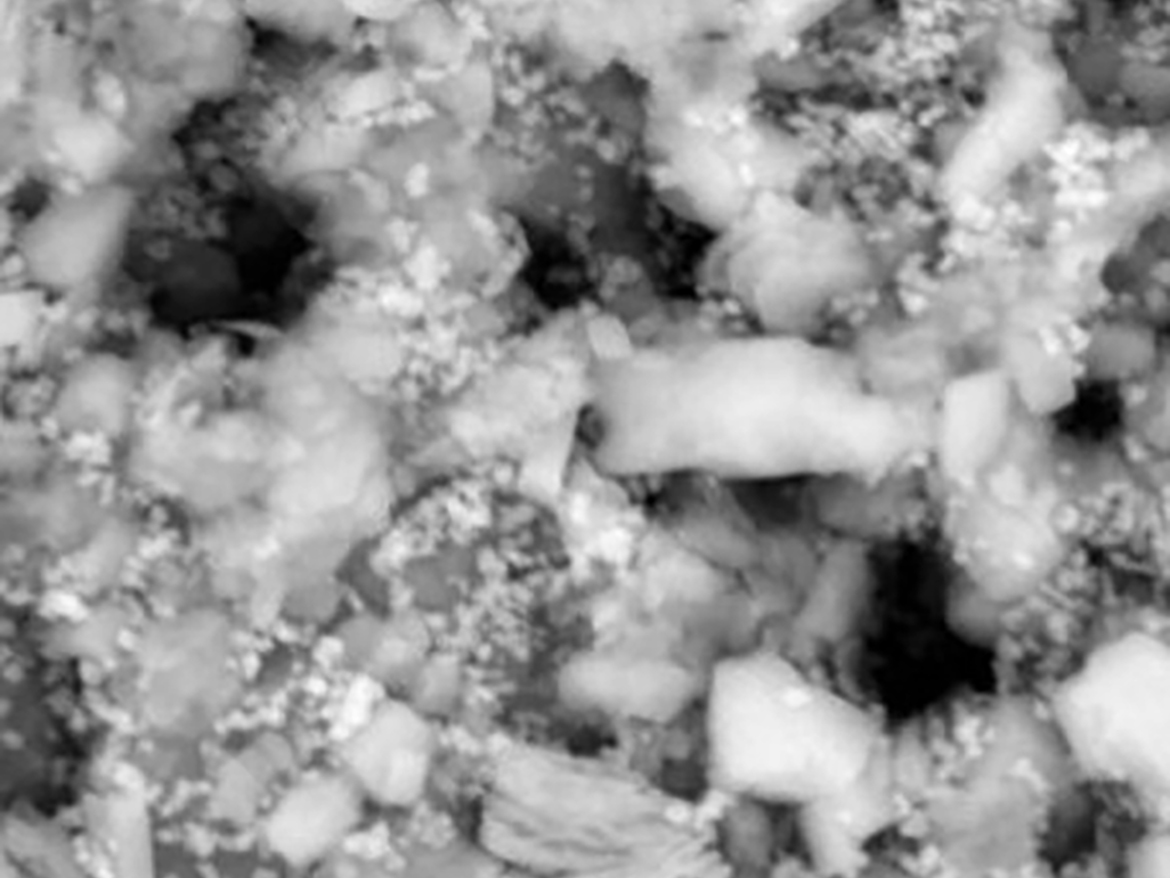
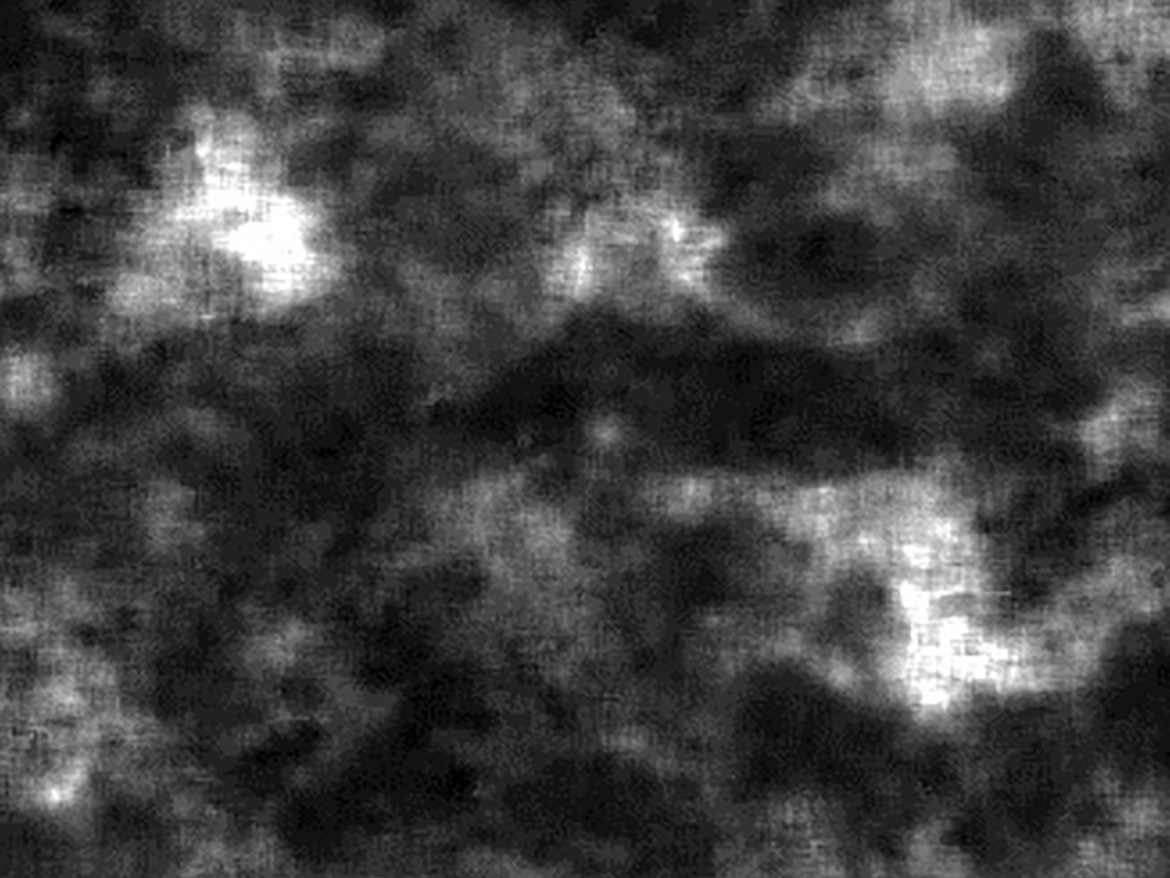
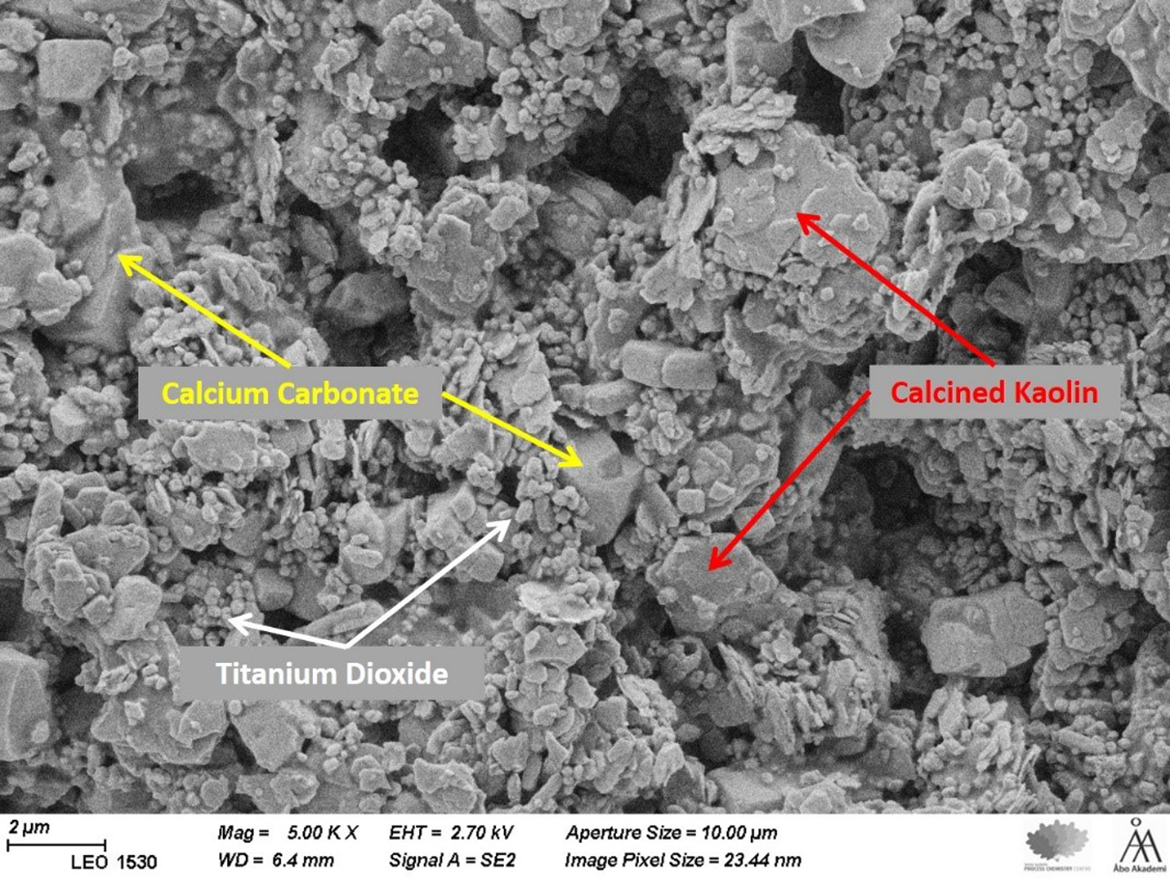
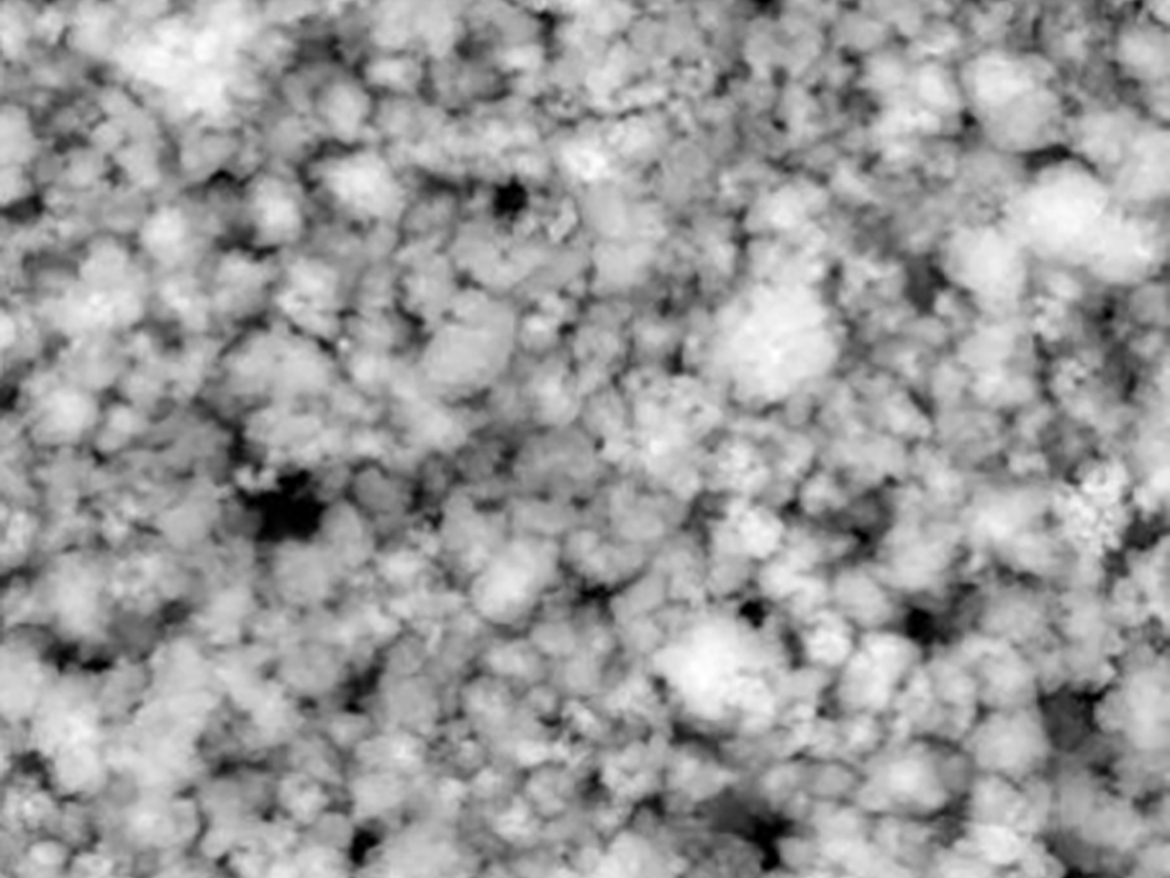
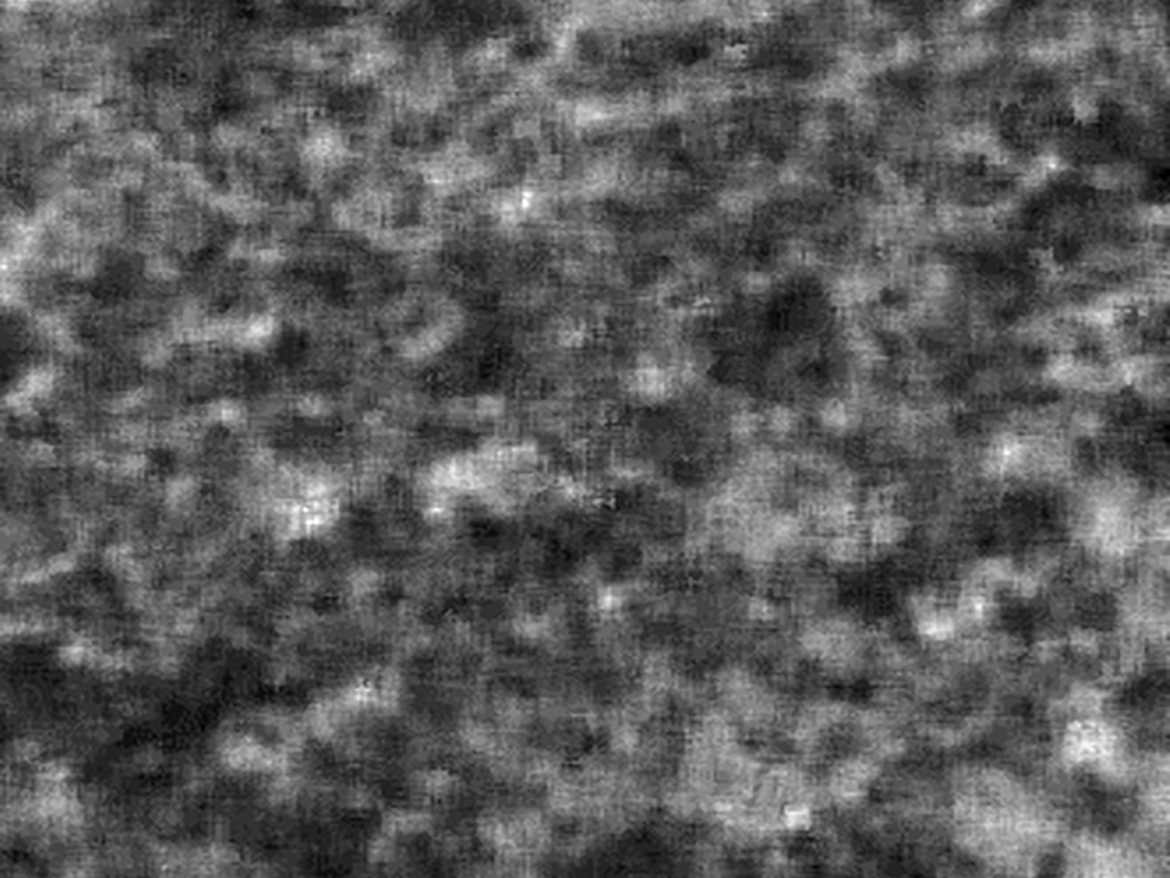
The actual state of pigment flocculation and crowding can be seen in the following series of SEM and EDAX images of a typical high-PVC matt paint.

In addition to the volumes occupied by the calcium carbonate and calcined kaolin, there are also air voids present that represent volumes from which the TiO₂ is excluded. Taking an EDAX image of the same paint and viewing only the Ti element gives an even more clear view of the poor flocculation, crowding and distribution of the TiO₂.
As mentioned previously, optimizing the TiO₂ by partially replacing it with a fine extender could help to provide more cost-effective opacity by reducing the crowding, however, this was also shown to cause a reduction in wet hide, particularly when replacement levels of 10% or more are used. Alternatively, reducing the extender size and locking the spacing of the TiO₂ in place could significantly improve the scattering power of the TiO₂, improving opacity and tint reducing power of the coating to provide a higher performance.
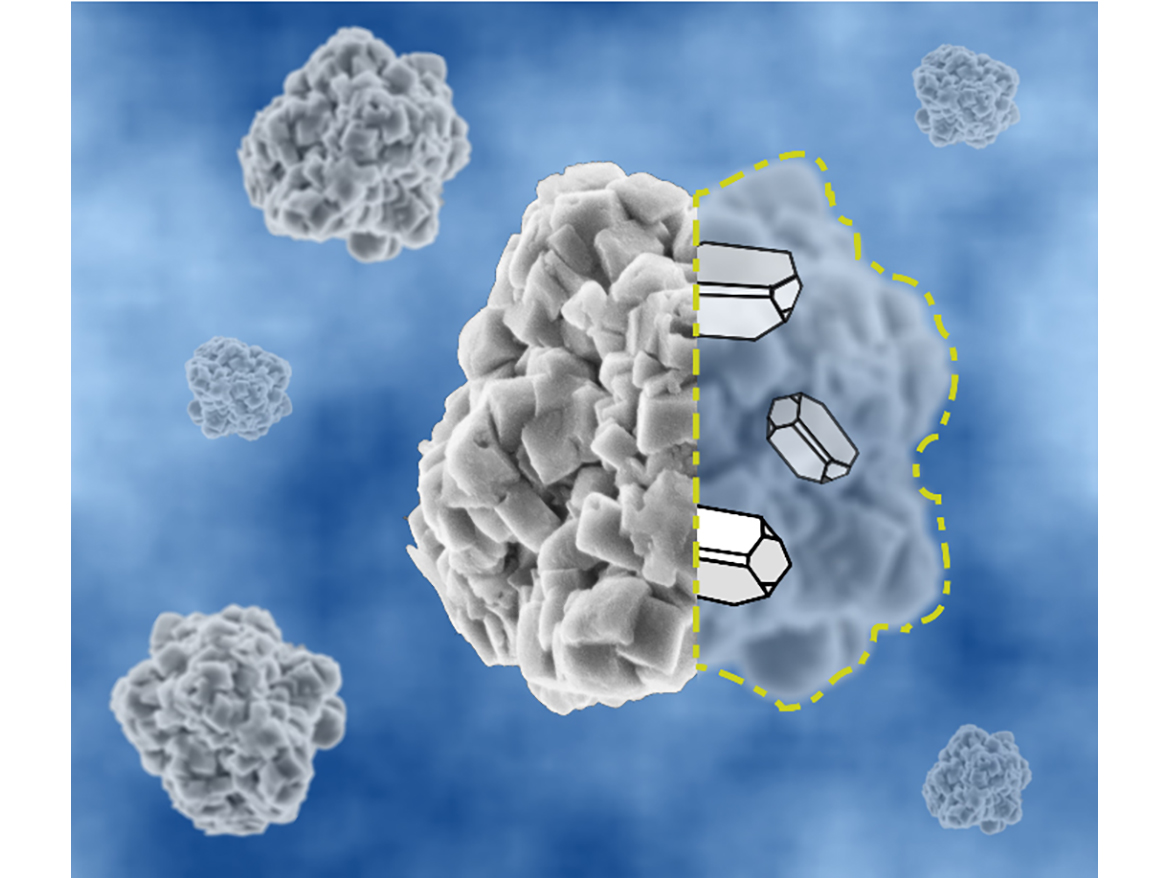
This concept has been evaluated in a formulation whereby all of the TiO₂ and extender was replaced by a composite pigment (Figure 12) of similar relative composition, i.e. the calcium carbonate and calcined kaolin extenders were replaced by PCC in the composite pigment. The resulting paint, therefore, contained the same volume of TiO₂ and extender, but the TiO₂ was locked into its optimized, spaced configuration.
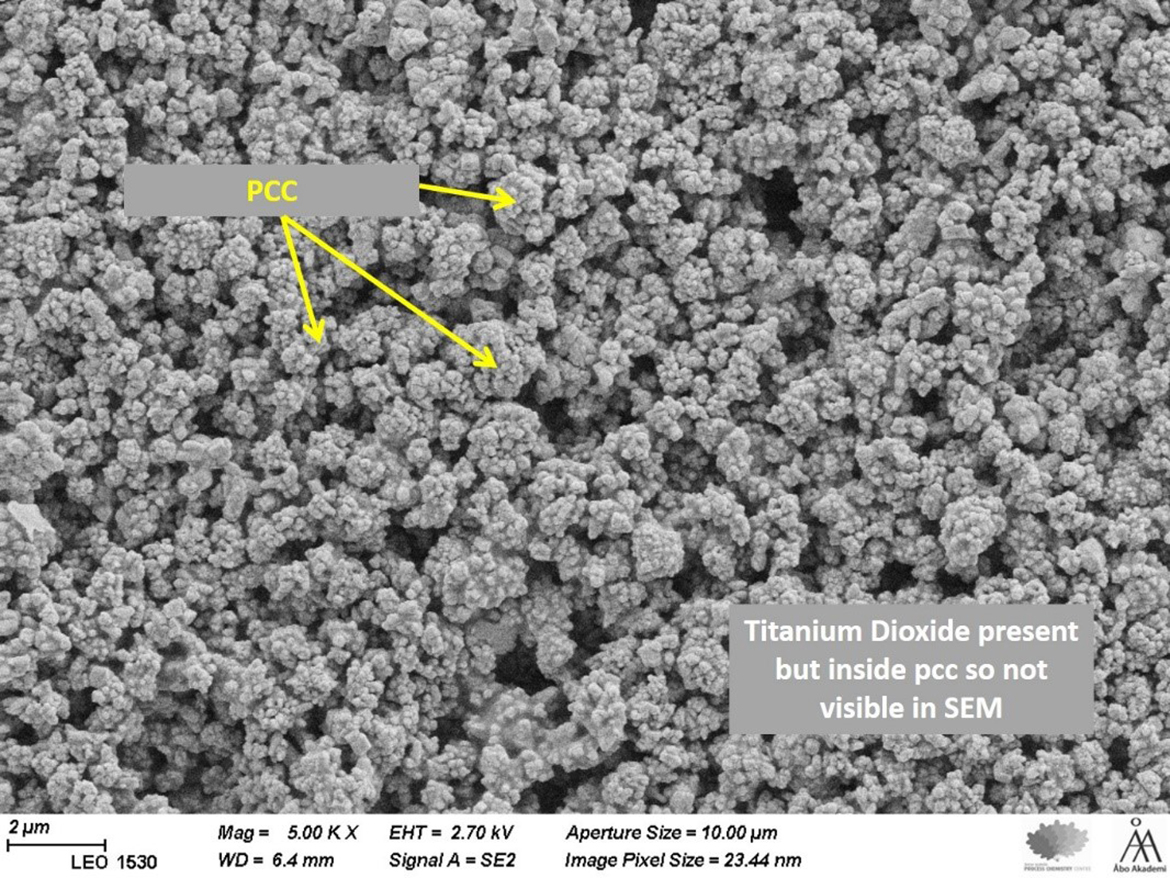
In Figure 14, the uniformity of the composite-containing paint, in comparison to the standard (Figure 13), can be clearly seen. However, since the TiO₂ is embedded within the PCC it does not show the improved distribution. This can be seen if we compare the EDAX images of the two paints (Figures 15-18).


The EDAX images of the elemental Ti clearly show the improved distribution of the TiO₂ in the composite paint (Figure 18). With such a significant improvement in TiO₂ spacing and distribution. the paint performance would be expected to be much higher, and this can be seen in Table 2 below.
Paint Performance Comparison
According to Table 2, the opacity increases from 96.7 to 98.2 units of CR at the same spreading rate. For a contrast ratio of 98% the composite paint can cover 4.5 m2/L more area, and the scatter per unit TiO₂ increases by more than 50%.

Comparison of the Paint through Simple Statistical Analysis
We have shown that the efficiency of the TiO₂ can be significantly improved if the TiO₂ is properly spaced and well distributed in the paint film. We also know that the dry opacity can be significantly influenced by crowding, flocculation, and excluded volumes (“windows”) in the film. Although a complex series of interactions and many factors such as particle size, shape, and packing also contribute to the final performance, we can take a more-simple approach at modelling the TiO₂ spacing. Figure 19 represents the standard paint that has already been optimized with a combination of extenders. Taking a given volume, and assuming that the TiO₂ is excluded from any volume occupied by the extenders, we can derive a nearest neighbour plot for the TiO₂ particles. In essence, we can determine how many TiO₂ particles will be flocculated, how many are perfectly spaced, and how many will be over spaced.
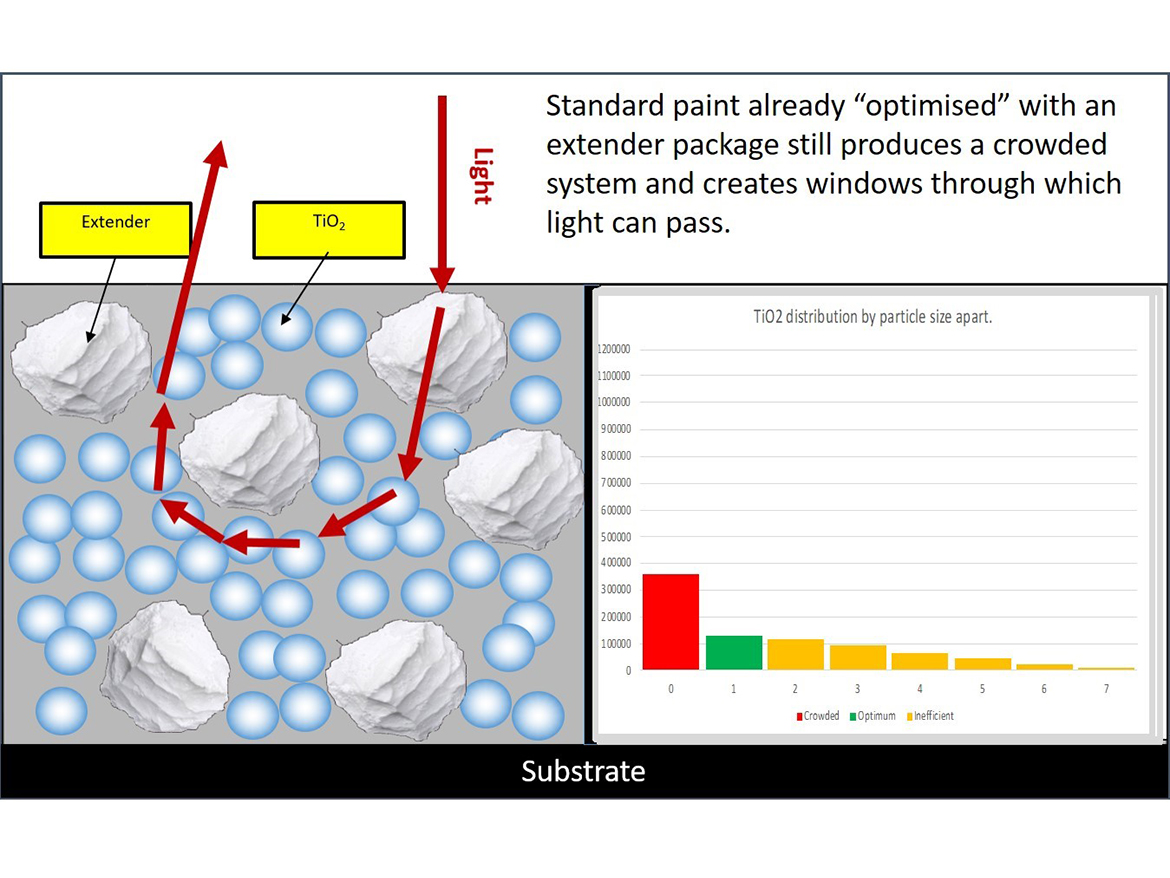
Here the red bar represents the number of TiO₂ particles that are flocculated or are closer than one particle apart. The green bar shows the number that are one particle apart, and therefore considered spaced, and the orange bars represent those particles that are more than one pigment particle diameter apart (over spaced).
The greater the number in the orange bars, the more windows there are for light to pass through. The more in the red bar indicates lower scattering TiO₂ particles, and those in the green are the ideal and most-efficient TiO₂ particles. In this matt paint, with large particle size extenders, a large proportion of the TiO₂ is flocced or crowded together, meaning that the TiO₂ is under performing.
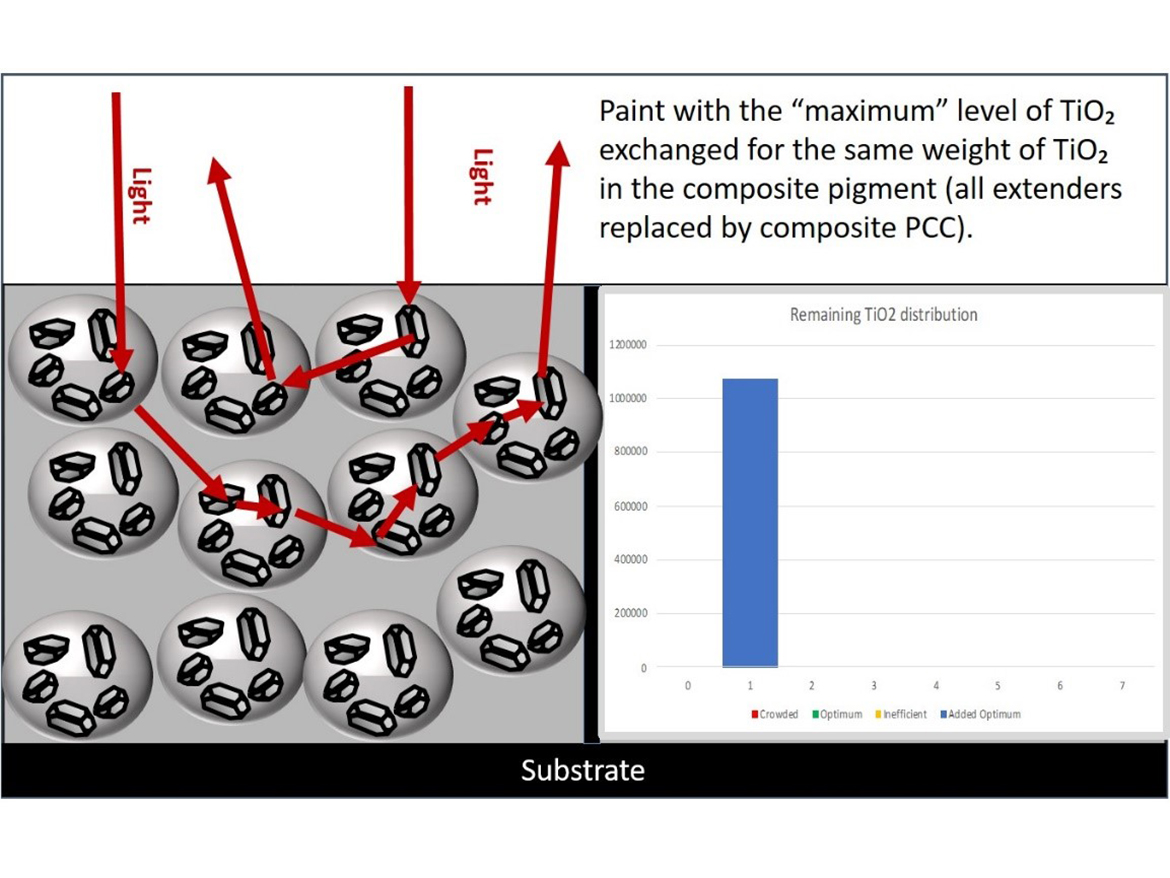
If we take the same modelling process and look at the maximum TiO₂ exchange (Figure 20), replacing all of the TiO₂ and extender with the composite pigment, we can see that all of the pigment is at the optimum spacing. Although the TiO₂ in the composite is close to optimum spacing there will be some doublet and triplet TiO₂ particles encased in the PCC. These doublets and triplets also exist in the random TiO₂ paint, however, they were not accounted for to keep the model simple. Air voids will also be present in the dry coating, and in some cases these will keep two composite particles apart. In this case, the TiO₂ in the two composites could be considered as over-spaced TiO₂, however their number will be relatively small compared to the overall spaced TiO₂ numbers.
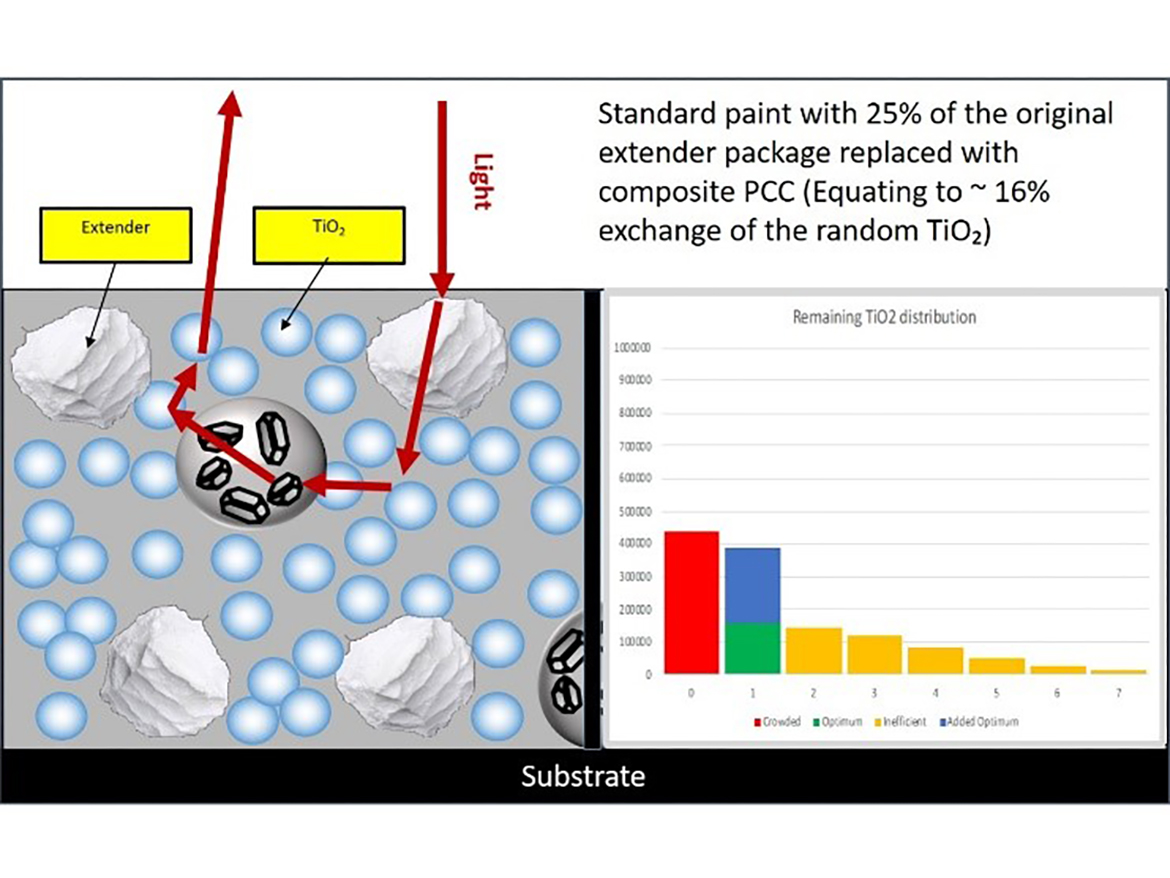
As we have stated, replacing all the TiO₂ and extender in a paint with the optimized composite pigment is somewhat unrealistic, but the partial exchange of TiO₂ and replacement of some extender is possible, and will lead to improvements in performance. For example, with 25% of the original extender replaced (approximately 16% of the random TiO₂ exchanged) we can see the effect on the optimally spaced TiO₂ count in Figure 21. Here we can see the contribution of the spaced composite TiO₂ (blue bar) to the optimally spaced random TiO₂ (green bar). Although not as clear, there is also a reduction in the red, flocculated TiO₂ and a smaller reduction in the over-spaced numbers.
In terms of performance, the E-25% paint develops 1.4 units more opacity than the standard, and, since the actual volume of TiO₂ remains constant, the wet hide remains the same. Provided the extender replacement remains at or below 33%, the other film properties remain similar to the standard, i.e. scrub and stain resistance, viscosity, and application properties. The introduction of a uniform composite pigment can lead to an increase in 85° sheen, but this is easily controlled with the larger extenders in the formulation or by the addition of a small level of matting agent.
Conclusions
When trying to optimize a matt paint formulation to provide more-cost-effective opacity, attempts to reduce TiO₂ through more effective spacing with fine extenders often leads to a reduction in wet opacity and a perceived reduction in paint quality, even when the dry performance is similar. The high refractive index of TiO₂ and excellent distribution in the wet film make it dominate the wet opacity, and any reduction is quickly seen as a reduction in wet hide. In an attempt to improve the quality and performance of a matt paint without detriment to wet hide, we have been able to use a TiO₂/PCC composite pigment with optimally spaced TiO₂ to replace some of the random TiO₂, thus increasing the scatter per unit TiO₂ and increasing the dry opacity.
At this stage we have not attempted to reduce the TiO₂ levels, however, the significant increase in the spreading rate of the newly optimized paint means the same hide can be achieved at a much-lower film thickness. This improvement can lead to benefits in sustainability such as lower carbon footprint and lower levels of material consumption. In addition, the ability to formulate high-performance one-coat paints with lower levels of TiO₂ will also be possible.
At present, we are working on converting the theory and modelling into real commercial applications and have seen significant improvements (∆CR +1.0 to +5.0 units) in several commercial matt paints. More information will be posted on our website www.fp-pigments.com when available.
The author would like to express his thanks those who helped with the lab work and statistical analysis, Jorgen Lindholm, Katrine Nylund, Piritta Andrejeff, Eveliina Hopeanaula and Andy White and to FP-Pigments for allowing the publication of the intermediate results.
References
1 Dietz, P. The effect of fine particle size extenders and entrapped air on the utilisation of TiO₂ in emulsion paints. European Coatings Journal 2003, 14-20.
2 Diebold, M., Kwonka, R.; Mukoda, D. TiO₂ scattering optimization and not-in-kind opacity alternatives. JCT Coatings Tech 2013, 10(2), 30-35.
3 Bohling, J.; Brownel, S. Painting a brighter future with chemistry: Innovating with higher performing and more sustainable pre-composite polymers. ACS Webinars 2018, January 10.
Looking for a reprint of this article?
From high-res PDFs to custom plaques, order your copy today!


