How Does Interfacial and Mixed Polymer Content Contribute to the Final Morphology of Latex Particles?

Did you know that interfacial and mixed polymer content in structured (sometimes called core-shell) latex particles comes about naturally during the second stage polymerization in the latex particles as phase separation and late-stage ripening takes place to create the final morphology of the particles? Depending upon the reaction kinetics and polymer chain diffusion conditions during the polymerization, we know that the amount of this mixed polymer can be very different from one set of conditions to another. Therefore, many times the particles will contain three phases of material; two pure (well, not always so pure) polymer phases and a mixed, or interfacial, phase. Each has certain volumes (masses) and these can be readily measured in the differential scanning calorimetry (DSC). Note that the interfacial polymer is not effectively seen in TEM images, even when chemical staining is applied.
Differential scanning calorimetry is the well-known and widely used technique to measure the glass transition temperatures (Tgs) of polymers. Of course, it also measures the degree of crystallinity in polyolefins, etc. By extension, the DSC thermal signal is also sensitive to mixtures of polymers that have different Tgs. Noting that the glass transition is not a first order thermodynamic change (as are vaporization and freezing – large enthalpic changes at a fixed temperature) thermal analysis of polymers results in significant changes in heat capacity as the temperature increases through the transition region. Thus, the DSC generates a signal that, when differentiated, results in a transitional “peak”. The maximum in the peak signal is, by common practice, taken as the Tg.
As we analyze a dried sample of composite latex particles we should expect to see three portions of the curve as mentioned in the above paragraph. While the signals for the two pure phases (if present) should be at or near their expected Tgs, the signals for the interfacial material will be present over the temperature span between those pure phase Tgs, as in the red and black curves in Figure 1 below. Should the composite sample contain no pure first or second stage polymer phase, the DSC signal would be distributed over the temperature range between the pure phase Tgs, as in the blue and pink curves.
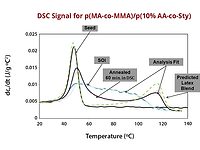
An experimental composite latex sample (acrylic(seed)/styrene-co-AA) is shown in Figure 2 where a highly mixed polymer state is seen in the non-annealed state, and the more phase separated states result from annealing the sample in the DSC at higher temperatures. There is also the possibility of quantifying the amount of mixed polymer by comparing the signals of the original and the completely annealed conditions.


These topics are discussed in detail in several of our STEP’n workshops, especially those for latex characterization (STEP 2) and core-shell morphology control (STEP 3). Scientific literature for these subjects can be found in our papers in J. Polym. Sci.: Part B. Polym. Phys., 43, 2790-2806 (2005), J. Polym. Sci., Part B: Polym. Phys., 49, 1583-1589 (2011), and Thermochimica Acta, 568, 20-30 (2013).
As always, we welcome your comments and questions by contacting us via our website, www.epced.com.
The “Did You Know….?” series is a bi-monthly note from Emulsion Polymers Consulting and Education (EPCEd) that is intended to present simple questions about topics that are important to those working in the emulsion polymers area. Short and concise answers to those questions are presented to educate readers and to elicit comments and further discussion. Some readers will already know the answers and be familiar with the topic, while others, especially those newer to the field, will benefit from the answers and discussion. Experienced practitioners may also find new insights in the discussion. Paint & Coatings Industry magazine has partnered with EPCEd to share the “Did You Know” notes with our readers throughout the year.
Looking for a reprint of this article?
From high-res PDFs to custom plaques, order your copy today!


