The Global Sealants Market


The global sealants industry has experienced modest growth since the 2008-2009 recession, as the construction and automotive industries recovered in western economies and rebounded more sharply in emerging regions. The world consumed 3.73 billion pounds of sealant in 2012, worth $8.8 billion, and volume is forecast to grow 5% annually through 2017.
Sealants can provide energy savings that lower green house gas emissions. Sealants can also serve to improve safety, such as an automotive windshield adhesive/sealant or a fire stop product. They are used in such specialized applications as aircraft fuel tanks and in the construction of solar panels, and also find use in more commonplace tasks, such as sealing a bathtub. Although sealant volume is concentrated in construction and automotive, there are a multitude of specialized applications for sealants in these and other end uses.
Regional Overviews
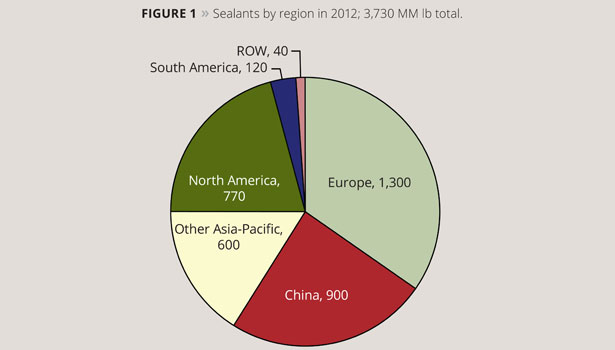
The Asia-Pacific region consumed 40% of the global sealant volume in 2012 and 32% of the value. The region is the world’s largest user in volume and is second behind Europe in dollars. China is the biggest outlet for sealants in Asia-Pacific, with 60% of the poundage and 48% of the value. China’s soaring construction and automotive industries have contributed to the rapid rise in sealant consumption. Demand is now moderating, but a still robust 10% annual rate of growth is forecast through 2017. Japan is the second largest sealant consumer in the region with 22% of the pounds and nearly 30% of the dollars. Japanese volume in 2011 was negatively impacted by the earthquake and Tsunami but recovered somewhat in 2012. Sealant volume is still down considerably from the middle of the last decade. South Korea, like Japan, is a mature sealant outlet, consuming 7% of the region’s pounds and 9% of the dollars. India is the fastest-growing consumer of sealants in Asia-Pacific but represents only 5% of the sealant pounds and dollars.
Europe is the largest global outlet for sealants in dollars with a 40% share in 2012 and is second in poundage with a 35% share. Sealant growth in Europe is placed at a mature 2% annual rate. European Union (EU) member countries were 88% of the regional volume. EU sealant consumption in 2012 was negatively impacted by the debt problems of some of its member countries. Non-EU countries, such as Russia and Turkey, are forecast to increase at double the regional growth rate.
North America consumed 21% of the global sealant pounds in 2012 and 24% of the dollars. Like Europe, the North American market for sealants is mature. Automotive and construction usage grew modestly in 2012 as the housing market improved and vehicle production continued its expansion from the lows of the recession. Brazil is the largest user of sealants in South America, which consumed 3% of the world’s sealant volume and dollars. Figure 1 shows global sealant consumption by region in 2012.
End Use Review
Excluding insulating glass sealants, which are discussed separately, construction is the largest outlet for sealants, taking 62% of the global sealant volume in 2012 and 61% of the dollars. A 5% annual growth rate is projected for construction sealants, with China the major growth engine. The construction industry in the United States and EU has struggled to recover since the 2008-2009 global recession, with the United States recently showing signs of improvement. More recently the debt problems of some EU member countries have impacted the construction industry. In contrast, Russian construction sealant usage is growing modestly. The Asia-Pacific region took 39% of the construction sealant volume, with China 62% of the total. Europe consumed 38% of the pounds followed by North America with a 21% share.
Automotive applications consumed 24% of the sealant volume and 23% of the dollars and are forecast to expand at a 4% annual rate. Sealants are used both in new vehicle construction and the aftermarket. Global vehicle production in 2012 was some 80 million units, and there are now some 1.1 billion cars, trucks and buses on the roads. Large applications include glass bonding/sealing, seam sealing and form-in-place gaskets. These three applications took 85% of the sealant dollars. Plastisols, both vinyl and acrylic, are the leading automotive sealant type in pounds and are found in body-sealing applications. Polyurethanes are the leader in dollars, with most used in glass bonding/sealing.
Insulating glass sealant consumption was 8% of the global sealant poundage and 6% of the dollars in 2012. A 7% annual rate of growth is forecast, as insulating glass offers energy savings as well as the associated lower carbon dioxide emissions. Stricter building regulations, particularly in emerging economies, are a boost to consumption of insulating glass sealants. Sealants are used as both primary seals and as secondary seals. Silicones are now the largest-volume secondary sealant, having displaced polysulfide types. Hot melt butyl and polyurethanes are other secondary seals. Polyisobutylene is employed as the primary seal in dual-sealed and even triple-sealed units, and is outpacing overall sealant growth as these products are more energy efficient.
Industrial applications consumed 6% of the sealant volume and 10% of the dollars. Included are aerospace, solar panels, appliances, marine, maintenance and repair, and other applications. Aerospace is a small-volume outlet, which accounted for only 5% of the pounds but one-fifth of the dollars. Polysulfides are the leading aerospace sealant. Solar panels are a fast-growing application for silicone sealants, with about 30% of the industrial volume. Figure 2 shows the global consumption of sealants by end use.
Sealant Types
Silicones are the leading sealant in volume with 31% of the pounds in 2012, and are tied with polyurethanes in dollars with just over one-third of the total. Asia-Pacific is the largest user of silicone sealants with 54% of the volume, and China is the region’s biggest user with three-quarters of the pounds. Construction applications were an outlet for three-quarters of the global silicone volume. Insulating glass consumed 9% of the pounds, followed by automotive and solar panels, which each consumed 5-6% of the total.
Including air infiltration foams, polyurethanes are tied with silicones in dollars and are second in pounds, with a 26% share. Polyurethane one-component foams are sold in small containers and expand to seal spaces in buildings and homes. These energy-saving products are forecast to grow 5%/yr, with the fastest growth being in China. Air infiltration foams for consumer use have come under greater scrutiny because of isocyanate exposure concerns. The industry has responded with improved products, labeling, education and use instructions. Larger non-foam applications for polyurethanes include high-performance construction joints, automotive glass bonding/sealing, automotive body sealing and insulating glass.
Plastisols are used as vehicle body sealants and were 13% of the global sealant volume. Consumption is tied to global vehicle production. Emulsion-based sealants are largely acrylic types used for DIY consumer applications. They comprised 8% of the volume and 6% of the dollars. Butyl-based sealants were 7% of the global volume and are used in caulk, rope, hot melt, etc. forms. Polysulfide sealants have been losing share to other sealant types and were 5% of the sealant pounds and dollars.
Silyl-modified polymer-based sealants comprised 4% of the sealant pounds and 6% of the dollars in 2012. Most of these sealants are based upon silyl-terminated polyether polymers, but silyl-modified polyurethanes and other modified polymers are also used for sealants as well as adhesives. The major outlet is construction. Figure 3 shows sealant consumption by type in 2012.
Competitive Outlook
The top 10 global suppliers of sealants captured 47% of the sales, and each had sales of over $250 MM. The largest suppliers participate globally, while most of the smaller companies compete regionally. Suppliers range from those who offer only one sealant type, such as a silicone or air infiltration foam, to those that offer a wide variety of product types. Some suppliers are more focused on a single end use. Suppliers augment their sealant sales with related products and can participate in other industries, such as construction products, adhesives and coatings. Acquisitions continue to concentrate the supplier base.
The above information is based upon The Global Sealants Industry, a new study by Steven Nerlfi, Minesh Kusumgar and Michael Growney. For more information, phone 201-773-0785, e-mail nerlfikng@cs.com or visit www.kusumgar-nerlfi-growney.com.
Looking for a reprint of this article?
From high-res PDFs to custom plaques, order your copy today!


