The Conference Board's Consumer Confidence Index, which had declined in October, posted another loss in November. The Index stood at 90.5 (1985=100) in late November, down from 92.9 in October.
According to the Commerce Department, even if economic growth is slowing to 3 percent in the fourth quarter, those numbers would still be much better than in some of the European economies (less than 1 percent growth) or Japan (where GDP growth stopped altogether).
Consumers boosted spending at the fastest pace in a year during the third quarter. And businesses also increased spending on equipment and software, but they didn't invest as aggressively on building inventories, a factor that restrained economic growth in the third quarter. The bloated trade deficit also weighed on economic activity.
Finishers, though, are still quite upbeat about business prospects in the coming year, according to Industrial Paint & Powder's 18th annual Finishing Market Survey. Of 360 respondents, 57 percent say that their operating levels in 2005 would be higher than in 2004. Two years ago, only 53 percent of respondents indicated business would increase. Only 5 percent of respondents said their operating levels would decrease in 2005, the same as the last two years. About 38 percent of respondents indicate that business will remain about the same as last year - that is the same percentage as last year.
About 42 percent of respondents in the current survey say orders are on the increase, compared with about 35 percent in last year's survey and 31 percent two years ago. Only 3 percent of respondents say that orders are declining. The percentage of finishers indicating that they were optimistic about the coming year is 26 percent, while the percentage indicating that they were pessimistic about the coming year remained the same as last year at 4 percent.
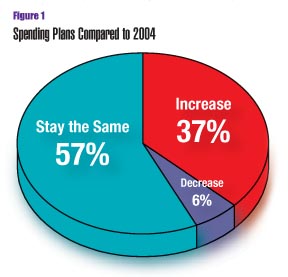
The number of finishers saying they would increase spending for finishing equipment - 37 percent - is up 4 percent from last year (Figure 1), while the percentage saying they would decrease spending - 6 percent - is down from last year's figure.

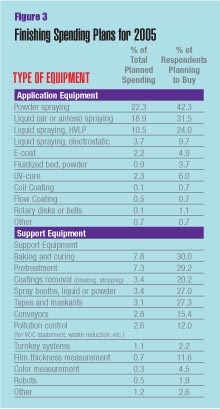
In recent years, a reduction in operating costs was the principal motive for new investments in finishing equipment. This year, like last year, upgrading or replacing aging equipment was the main reason for investing in new equipment, the motive cited by 50 percent (multiple responses are allowed), down from 54 percent. This was followed by the need to reduce operating costs (48 percent).
Other reasons for purchasing new equipment include:
Increase capacity - jumped to 46 percent from 39 percent last year.
Improve coatings appearance/performance - 39 percent (consistent with the last few years).
Environmental compliance - 27 percent (this percentage had declined up until last year, but it is up 1 percentage point this year).
Expand/improve color-change capabilities - 16 percent (up from 12 percent last year).
Conversion to new coating system, 9 percent (down from 12 percent last year).
When asked which costs would be reduced to justify investment in new finishing equipment, "direct labor" was cited by 58 percent of respondents, up 8 percentage points from last year. "Scrap and rework" was cited by 55 percent of respondents as a justification for investing in new equipment, up from 50 percent last year. Other spending justifications include "material costs," 41 percent; "indirect labor" (setup, maintenance, material handling), 40 percent; "in-process inventory," 14 percent; and "warranty and field service," 14 percent. These spending justification percentages were similar to last year's numbers.

In the plant
Capacity-utilization rates in 2004 changed little from 2003 rates. The capacity-utilization-rate categories were:• Less than 50 percent capacity, checked by 26 percent of respondents
• 50 to 59 percent capacity, 10 percent
• 60 to 69 percent capacity, 15 percent
• 70 to 79 percent capacity, 18 percent
• 80 to 89 percent capacity, 14 percent
• 90 percent capacity or more, 17 percent
The percent of companies saying that they send at least some of their parts out to custom coaters to be painted or powder coated - 29 percent - continues to decline from 33 percent the last couple of years and 45 percent three years ago. The majority of finishers say that less than 10 percent of their coatings requirements are handled by custom coaters (Figure 5).
Other trends and forecasts
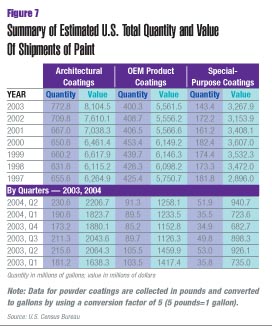
According to the latest census bureau data (Figure 7) , OEM coatings shipments for the first half of 2004 are down quite a bit -13.4 percent - over the first half of 2003, but architectural coatings have risen by 6.1 percent. Shipments of special-purpose coatings fell slightly from 88.8 million gallons in the first half of 2003 to 87.4 million gallons in the first half of 2004.From 1998 through 2000, shipments of OEM coatings showed healthy gains each year, increasing from 428.3 million gallons of paint in 1998 to 453.4 million gallons in 2000, before declining to 406.5 million gallons in 2001, 408.7 million gallons in 2002, and 400.3 gallons in 2003. Shipments of special-purpose coatings fluctuated a bit, from nearly 173 million gallons in 1998 to 182 million gallons in 2000, up to 172.2 million gallons in 2002, and down to 143.4 in 2003.
One survey respondent makes this prediction: "The economy is a reality and manufacturing in low-tech markets or service offerings will become a thing of the past in the next five years."
The National Association of Manufacturers' new president, John Engler, emphasizes the importance of NAM's Campaign for Growth and Manufacturing Renewal. The Campaign, which was launched by the NAM Board of Directors in early 2003, reminds the United States that while manufacturing is more productive, innovative and critical to America's economy than ever, it also faces historic challenges. "In fact, there are substantial downside risks of the United States losing its manufacturing base and competitive edge," Engler says.
"U.S. manufacturing, if it were a nation, would be the world's fifth-largest economy," he says. Manufacturing accounts for three-fourths of U.S. exports and the majority of private-sector R&D, according to Engler. "It also accounts for 13 percent of our GDP and 11 percent of employment - figures that understate manufacturing's impact because rapid advances in technology reduce the need for labor, and increasing efficiency drives down the cost of manufactured goods," he says.
Yet, U.S. manufacturing is challenged as never before, he says. Fierce global competition prevents manufacturers from raising prices, but costs continue to rise, often because of government policies, according to Engler. He adds, "These costs threaten the viability of manufacturing in America. Manufacturers also face an uneven global playing field, and the growing specter of insufficient numbers of skilled workers in the coming years."
At a November meeting of the trustees of the Manufacturing Institute, NAM's research and education arm, Engler says that Institute Chairman Tim Timken and other trustees concluded that the Manufacturing Campaign effectively put manufacturing issues on the radar screen during the recent election cycle through research reports, communications, advertising and NAM-member involvement around the country. In particular, the costs study, ‘How Structural Costs Imposed on U.S. Manufacturers Harm Workers And Threaten Competitiveness,' [www.nam.org/costs] is now a frequently cited source in the debate over public policies affecting manufacturing."
According to Engler, the Institute will do several things to help thrust the manufacturing sector. Among them, the Institute will execute a communications and advertising awareness campaign that aims to change attitudes about manufacturing through print, radio, television and Internet; conduct new research initiatives that dispel outmoded notions of manufacturing while putting forth the new, high-tech realities of the industry; and communicate with young Americans, parents and educators to make manufacturing a preferred career path by 2010 through the "Dream It. Do It." campaign.
The future prospects for the American economy depend heavily on the vitality of U.S. manufacturing, says Engler. "Our manufacturing base is too important to neglect. The recent elections provide a priceless opportunity to advance our pro-growth policy agenda in the next Congress. The messages of the Manufacturing Campaign will under-gird our work in advancing our policy agenda. I look forward to working closely with NAM members to deliver this very important message," he says.
On a positive note, Engler says that in mid-November, in the waning days of the 108th Congress, Senator Tom Carper (D-DE) met with members of the National Association of Manufacturers in Washington to discuss legal reform. Engler says that Senator Carper and he are both former governors with a determination to bridge differences and solve problems. "We both believe that Congress must address lawsuit abuse in the 109th Congress that convenes next January.
"While legal reform, energy legislation and a host of other matters are ‘unfinished business,' NAM members nonetheless secured a significant number of policy achievements during this past Congress, victories that will benefit U.S. companies and workers alike."
He says, for example, the American Jobs Creation Act, signed by President Bush in October, will provide $138 billion in tax relief to allow U.S. companies, including S corporations, to invest in their workforce, new equipment and R&D.
Likewise, he says the Pension Funding Equity Act, enacted in April, is saving NAM members about $80 billion in unnecessarily inflated pension contributions over two years. "And we expect U.S. exports to Australia to rise by nearly $2 billion per year, thanks to the U.S.-Australia Free Trade Agreement," which went into effect on January 1, 2005.
NAM members also won victories on issues including the R&D credit, alternative minimum tax, the 2003 tax cuts, the Chile Free Trade Agreement, miscellaneous tariffs, ergonomics, Internet tax moratorium, Medicare reform, Health Savings Accounts and other issues, Engler says.
"Our achievements extended to the electoral process, as well, as manufacturing companies and employees participated in this year's elections in record numbers," he says.
"While we can take pride in our successes, our job has only begun, " he says. "The election results provide us with an excellent opportunity to advance our pro-growth agenda in 2005. Using the same tools that we used in the Prosperity Project - employee involvement and education - we can change policy outcomes in the coming year on legal reform and the other issues that are so important to the future of manufacturing and the American economy."
Editor's Note:
Industrial Paint & Powderwould like to thank the many readers who took time to participate in this year's market survey. To gather information for the survey, questionnaires were mailed in September to a representative sample of senior-level manufacturing managers at 3,500 U.S. finishing locations. A total of 454, or 13 percent, were returned. A sample this size offers a 4.6 percent margin of error at a 95 percent confidence level. This survey's intent is to highlight industry trends rather than set specific dollar expenditures for individual sectors of the market. We welcome comments and suggestions regarding the survey. Send them to spielmans@bnpmedia.com.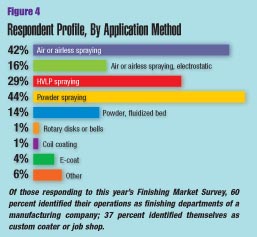
Sidebar: The "Typical" Finisher
Finishing operations vary widely in size and scope of operations; thus, attempting to provide a snapshot of the "typical" finisher is no easy task. But the responses to Industrial Paint & Powder magazine's 18th annual Finishing Market Survey provide detailed information about staffing, spending , application methods and much more for small and large finishers alike.While finishing facilities that use a relatively small amount of liquid paint comprise a huge portion of all facilities using liquid coatings, the same is less true for powder finishers. Of those respondents using liquid coatings, 55 percent use less than 100 gallons per month; 100 to 249 gallons, 14 percent; 250 to 499 gallons, 8 percent; 500 to 999 gallons, 7 percent; 1,000 to 2,499 gallons, 8 percent and 2,500 gallons or more, 8 percent. Conversely, about 29 percent of shops applying powder coatings use less than 250 pounds per month; 250 to 999 pounds, 22 percent; 1,000 to 2,499 pounds, 14 percent; 2,500 to 9,999 pounds, 23 percent; 10,000 pounds or more, 12 percent.
The majority of the respondents (66 percent) say their finishing operations occupy less than 10,000 square feet; about 46 percent occupy less than 5,000 square feet. About 6 percent occupy 50,000 square feet or more.
When asked about the age of their equipment, 23 percent of respondents said their liquid application equipment was less than three years old; 36 percent, three to five years old; 24 percent, six to 10 years old; 17 percent, more than 10 years old. These numbers were very close to last year's numbers. Regarding powder application equipment, 24 percent of respondents said their equipment is less than three years old (same as last year); three to five years old, 38 percent (compared to 35 percent last year); six to 10 years old, 25 percent (compared to 29 percent last year); and more than 10 years old, 13 percent.
On average, respondents say that about 12 people are directly involved in the company's finishing activities, though 70 percent of respondents say they employ 10 people or fewer. The number of people involved in finishing, according to respondents, has fallen significantly the last few years, including this year's drop of four employees.
How are those employees applying paint and powder? About 42 percent of respondents use air or airless spraying, which is about the same as the last two years but down from 48 percent three years ago. That category is now slightly behind powder spraying (44 percent), up from 34 percent a few years ago. About 29 percent employ HVLP spraying and 16 percent use electrostatic liquid spray equipment (Figure 4).
And what are they coating? Ferrous metals account for 63 percent of total coating volume, while nonferrous metals account for 20 percent. Those numbers have remained fairly consistent over the last several years, though ferrous metals are down and nonferrous up a point or two compared to last year, and respondents indicate no plan to change that over the next two years. Wood accounts for 9 percent and plastic 5 percent of total coatings volume.
About 20 percent of respondents say they are reformulating their coatings. Of those that do, here is a breakdown of company purchases (multiple responses were allowed): solvents, 78 percent; additives, 62 percent; pigments 57 percent; and resins 29 percent.


