Formulation Optimization Utilizing DOE Mixture Statistics


This problem can be studied using the traditional scientific approach of isolating independent variables and examining their impact on the desired properties. However, when this is done, it quickly becomes apparent that something is being missed. One by one, the optimal amount of each formulation component is empirically determined through experimentation, but when these components are combined at the determined ratios, the results are far less desirable than predicted.
When evaluating Borchi® Gen 0451 pigment dispersant in CAB/TPA automotive refinish applications, this phenomenon was experienced. Laboratory trials to evaluate Borchers® dispersants produced inconclusive and even conflicting results. The problem lies in the fact that the separate components could have interactions with each other with respect to the desired properties. For example, when the formulator changes the level of dispersant in the grind formulation, the loading of the other components is also changed. If all the components have interactions with the responses, how can you conclude that changes in the desired properties are due only to the change in dispersant level – even if the ratio for the other components remains constant? If one plans traditional experiments, altering the ratios of each component individually and in combination with the other components, the number of trials adds up quickly, and this approach is simply not feasible.
There is a powerful statistical approach that is well suited for formulation optimization. It is a subset to the design of experiment (DOE) technique called mixture statistics. This statistical technique is designed to allow the experimenter to account for all component interactions, and calculate a formulation that is most likely to maximize the desired properties.(1)
Unfortunately, a common response to the mere mention of DOE is skepticism and resistance. It is true that a traditional factorial DOE is very limited in value when applied to formulation development. However, a DOE need not be the all-encompassing, labor-intensive exercise that many have encountered. In fact, the proper application of DOE methods should minimize the amount of time and resources needed to achieve the desired goals.(2-4)
The Formulation
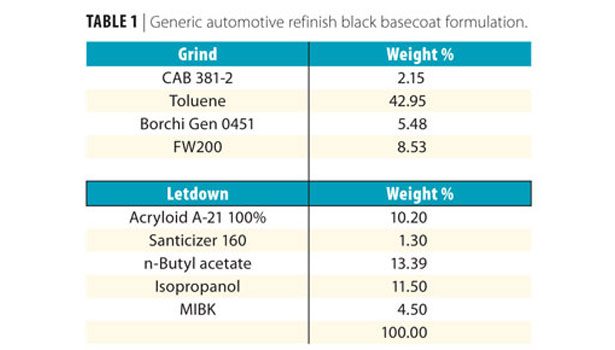
To illustrate the use of mixture statistics, a generic automotive refinish black basecoat formulation was chosen (Table 1). Design Expert® by Stat-Ease, Inc. was used to develop the mixture DOE. This project focused on optimizing the grind formulation for maximum color development and gloss.
Mixture DOE
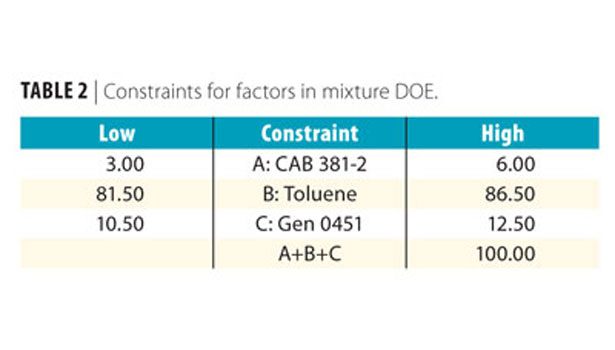
Three components were included in the mixture, keeping the level of carbon black constant for each trial: A: CAB resin; B: Toluene; C: Borchi Gen 0451. In a mixture DOE, all of the components are varied based on a statistical model, with the total adding up to a predetermined constant (in this case, 100 parts or percent). However, it is not useful to include trials that are not feasible. For instance, one would not want to include trials where the level of CAB resin is higher than the maximum soluble amount. These are called constraints. The constraints for the grind mixture DOE are listed in Table 2.
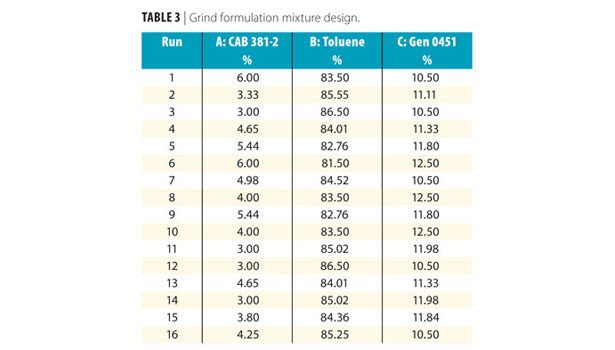
The responses (desired properties) were defined as R1: 60° Gloss, and R2: L* value. Using the quadratic design model, the trials were generated as listed in Table 3.
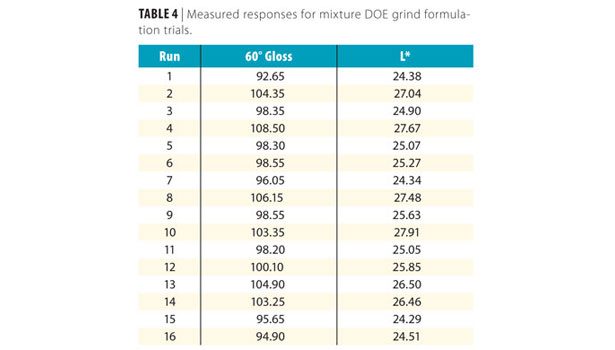
Each of these trials was used to disperse 12.66% carbon black and processed simultaneously for 2 h on a LAU DAS-200 disperser. The resulting paint samples were drawn down at 5 mils wet thickness and allowed to dry for 12 h at 25 °C, 50% relative humidity. The drawdowns were then measured for color and 60° gloss; the results can be found in Table 4. After analyzing the results, it was determined that this mixture has A:B:C interactions for each component, confirming the theory that complex synergies exist in this formulation.
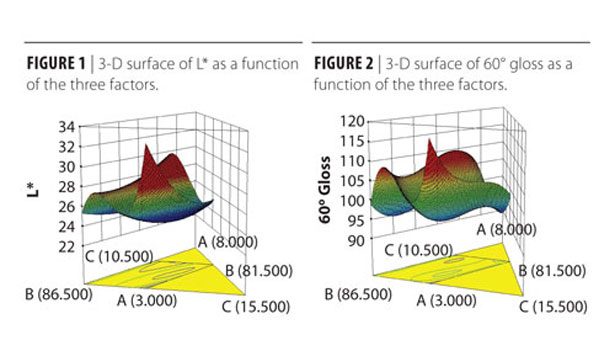
After selecting a model that best fit our data and accounted for these interactions (in this instance the cubic model), we generated a visual representation of our three-component mixture with respect to each response (Figures 1 and 2).
Examining these graphs, it was apparent that our responses had conflicting optimal formulations. Mixtures that maximized gloss also minimized color strength and vice versa. The goal now was to find the optimum formulation that provided the best color strength in combination with the best gloss. The good news was that we had all the data necessary to accomplish this.
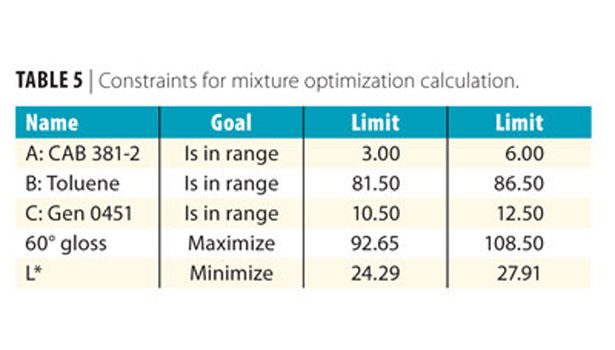
The optimum grind formulation could now be calculated by choosing the constraints found in Table 5.
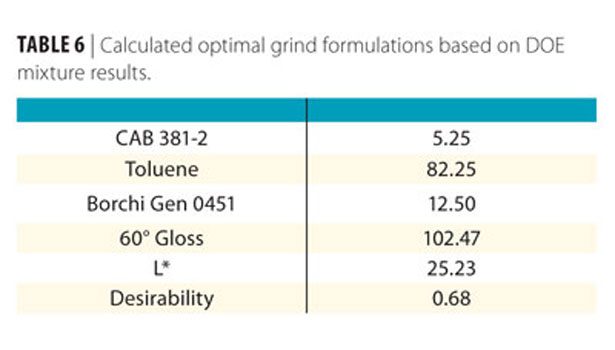
The Design Expert software then interpolated 40 additional responses based on the model, and provided the suggested optimized formulation (Table 6).
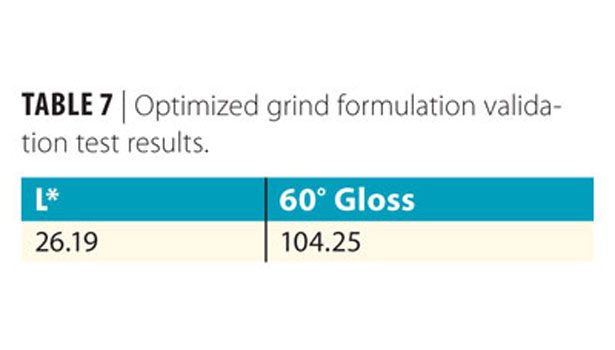
Validation
Conclusions
The use of mixture statistics with formulation development is valuable because it provides a clear, concise path to obtain an optimum formula within a practical number of trials.
However, this technique can also provide a complete understanding of interactions that exist between all of the ingredients with respect to the desired properties. Limitations of the formulation are also characterized, preventing the formulator from setting specification goals that are unachievable using current raw materials and processes.
This information provides additional value to the time and resources expended developing the formulation that traditional trial work simply does not offer.
E-mail Kip.Howard@na.omgi.com for more information, or visit www.omgi.com or www.borchers.com.
The author would like to thank the following individuals for their contributions: Mary Hopkins, Nicholas Schady, Susan Vicha and Timothy Armistead.
Looking for a reprint of this article?
From high-res PDFs to custom plaques, order your copy today!


