Measurement Techniques for Acrylic Artist Colors

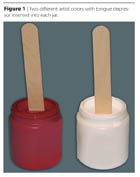
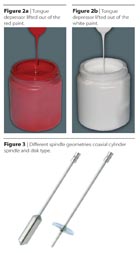
The explanation is that there are two desired attributes at work: yield stress and shear rate dependency. These physical properties account for several aspects of flow behavior. A sufficiently high yield stress allows the pigments, resins and other additives to remain suspended in the paint and stay on the artist's brush after dipping. The stationary tongue depressor in the paint jar confirms this. A shear thinning paint allows the paint to transfer easily onto the canvas. Artists would complain if this were not the case.
Consider what an artist would ideally want the paint to do: be easily mixed by the user (simple shaking or gentle stirring), readily attach itself to the brush when dipped into the paint, flow without spreading beyond the width of the brush when applied and stop flowing without dripping when the brush is lifted off the canvas. These actions are a combination of imposed shear stress and shear rate. If the yield stress of the paint is too high, the paintbrush may splay or go into the fluid at an angle other than along the path of insertion; if the yield stress is too low, then the paint may fall off the brush after removal.
Another concern arises if the paint doesn't get thinner (also known as "shear thinning") in response to being applied by a brush to the canvas. The effect can be a blotch-like appearance and visible mounding of the paint on the coated surface. The opposite problem occurs when the paint gets so thin that it spreads out in an undesirable way on the item being painted. These instances reflect several situations in which the product isn't performing properly.

Knowing what is needed for proper product performance allows the manufacturer to find a suitable measurement technique that will ensure consistent product quality. For example, when an acrylic paint is measured by a rotational viscometer, it is done traditionally with a single-point viscosity method: instrument torque range (typically RV), disk spindle (RV#4), single speed (100 rpm) and at an elapsed time (60 seconds). This provides the manufacturer with a way of creating a viscosity target value as a pass/fail point. This is an acceptable, reproducible way of replacing the sometimes-used subjective test of hand stirring the paint, seeing how it 'feels' and then visually evaluating how the paint 'looks'. However, this does not give the full story on flow behavior since only one rotational speed was used.
The acrylic paints shown in Figure 1 were tested for shear dependency with two rotational methods that are widely used in the industry. In addition, each method employed different spindle geometries: disk type spindle and coaxial cylinder (Figure 3). A simple viscosity plot of the red and white acrylic paints shows that both have similar viscosity values when measured with a Brookfield RVDV-II+PRO viscometer, disk spindle RV#4, at 100 rpm. What we see in Figure 4 are two fluids that appear to be the same viscosity, 958cP and 906 cP. The red sample, however, is thicker than the white sample by 52 cP. In addition, both maintained the same viscosity value over time, which indicates that there is no time dependency (also called thixotropy). Knowing this, we would now want to look at the shear rate dependency to see if there is a difference in the way the fluids behave. To be sure that we get what we see, we need to learn more about these paints at other use points.
Using a Brookfield RVDV-III Ultra Rheometer with a coaxial cylinder spindle SC4-21 in a Small Sample Adapter chamber, a shear profile of the fluids reveal that both are very shear dependent (Figure 5). The red paint is 3000 cP, thinning to 710 cP and the white paint is 2700 cP, thinning to 700 cP. Both have similar decrease and recovery in viscosity and behavior. Therefore, we conclude that both paints will flow in a similar fashion when stroked by the brush onto the canvas surface.
This flow curve information still doesn't explain why the paints look somewhat solid in the jar and can support a tongue depressor. That brings us to the use of a new measurement method.

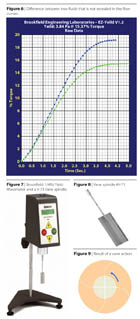
It has been demonstrated that the measured viscosity of the white paint is only marginally thinner than the red paint. We would still need to know if the white paint will hold onto the artist's paint brush as well as the red. It is this yield stress characteristic that is measured in Figure 6, which shows a difference between the two fluids that is not revealed in the flow curves of Figure 5. Evaluating yield stress can provide additional information that the single point and multiple point viscosity tests can't easily provide. To understand the benefit of knowing what yield stress can tell us and how it can compliment viscometric measurements, it is good to understand what yield stress is.

For purposes of this article, let's think of yield stress as being a measurement of the gel structure in the paint that allows it to hold the tongue depressor upright. Many acrylic paints have low yield stresses and so they are easily stirred. Brushing the paint provides enough stress so that it flows easily and smoothly when applied. If the paint drips off the artist's brush, the yield stresses are so low that the artist loses the paint on its way from the jar to the canvas.
The yield stress curves in Figure 6 were measured with a Brookfield 1/4RV Yield Rheometer and a V-73 vane spindle. The white yields at 3.84 Pa and the red at 4.78 Pa. The yield stress values for both are sufficient enough to hold the tongue depressor upright, but the difference in yield stress values between the two paints is what causes one to flow sooner off the tongue depressor than the other.
Conclusion
Interestingly, visual evaluation of the samples would have revealed that the white sample flowed more rapidly when the tongue depressor was removed than the red. However, nothing could have been said other than "the white looks thinner." Providing a more quantifiable and reproducible measurement method is always advocated when determining a product's pass/fail criteria. Rotational viscometers using single shear or varied shear for viscosity values and yield testers for yield stress values will certainly provide reproducible and meaningful measurements. This will definitely ensure that what you see is what you get.
Acknowledgements: Jack Roque, Golden Artist Colors
For further information, visit www.brookfieldengineering.com.
Looking for a reprint of this article?
From high-res PDFs to custom plaques, order your copy today!


