Wet Color Control - an Efficient Concept for Paint Processing

Reflection technology can also be used to measure wet reflection of coatings as they are being produced. Tests using statistical analysis and correlating dry versus wet methods confirm that it is possible to produce and match color specifications on the wet system. The technology of wet reflection and process control produces coatings that have lower color variability, saves time, allows automation and increases the product quality in comparison to traditional methods.
The wet correction system technology developed by NTP - Renner Herrmann S/A for the matching of colors is currently being used to match color specifications. This technology and process integrates a revolutionary concept for use in a batch or a continuous process production mode. The equipment developed for on-line use is called Colorcell.
Equipment Description
The basic concept of the cell is that fluid passes through a pressurized cuvette, where a spectrophotometer is coupled to read the wet reflectance curve. All the components are accommodated in a pressurized metallic cabinet adapted to use in classified areas with explosion risk. An embedded industrial microcomputer is responsible for all of the device control tasks, communication and transmission of the acquired data. The utilities needed to operate the equipment are electricity, compressed air and nitrogen.
The Colorcell operational capacity in autonomous regime (stand-alone) facilitates its use in laboratory applications as well as industrial applications (automated processes). The auto-cleaning facilities and the philosophy of easy setup are additional advantages when compared to the conventional process. Since the colorimetric software is part of the system, the wet correction of samples becomes very easy

Dry vs. Wet Correlation
Laboratory analyses, experimental tests and direct application in the paint processes were done to demonstrate the credibility and applicability of the wet color matching system. The paint used for analysis was a typical alkyd enamel for wood and metal surfaces consisting of resin, organic and inorganic pigments, additives, xylene and naphtha.The wet reflection of many samples was read. We also read their respective readings in dry drawdown mode. Correlation of wet and dry samples showed similar behavior. We analyzed 100 different colors and more than 1000 reflection curves during this experiment.
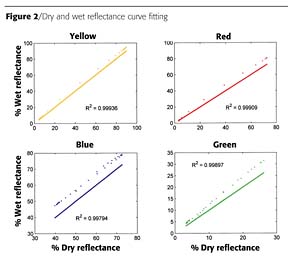
Data analysis showed that the dry reflection correlates with the wet reflection through a line with angular coefficient approximately equal to 1. Some variations in the angular and linear coefficient can occur due to the calibration of the equipment and the compensation for the glass window that separates the spectrophotometer and the reading cuvette. Figure 1 shows the correlation between wet reflectance (upper curve) and dry reflectance (lower curve) of the four basic colors. Figure 2 indicates the linear fit between the wet and dry reflectance curves, and Figure 3 shows the gray reflectance and the respective linear fit for each color. The Saunderson's Correction was applied on the curves.
Differences Between Dry and Wet Color Correction
Starting from a conventional dry color correction (batch correction), the paints were monitored from the initial sample to the final, approved sample also using the wet color correction system. All the samples had their wet reflectance and respective dry reflectance data stored. Based on that, it was possible to verify that the differences CIE L*a*b* were coherent in dry mode and wet mode. The wet correction behaves similarly to the dry correction.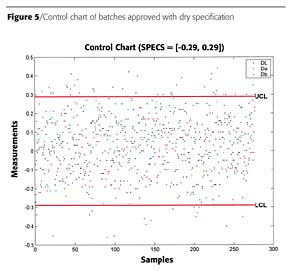
Wet Color Correction System
There is similarity in the color differences between dry mode and wet mode, indicating that it is possible to make a wet correction using the Colorcell wet correction system. Approximately 300 batches were corrected by the wet color correction system, and all the corrections converged to the wet standards. Those were checked in dry mode and they were also approved according to the dry specifications.
In a continuous production process, the main difference is that there is no intermediate correction of the batch tank. The system adjusts the flow of components with each new correction and produces on-spec product.
Statistical Process Control
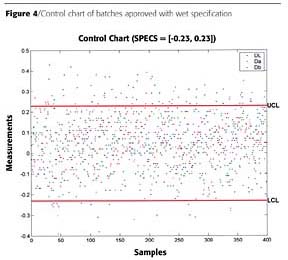
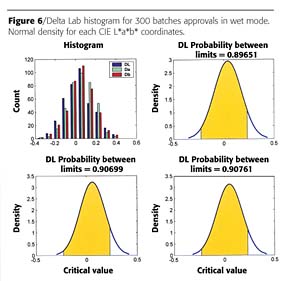
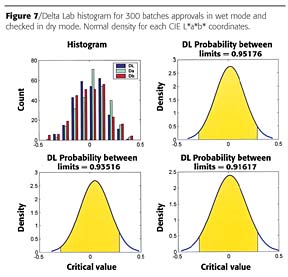
In a paint production, the color specification control is generally made calculating the CIE L*a*b* differences between the sample dry reflectance and the standard dry reflectance. In a wet control, for example, the dry specifications are guaranteed when the wet specification color is approved with an L*a*b* of ± 0.23. This correlates to a DE = 0.40. A specification of L*a*b* ± 0.29 correlates to a DE = 0.50, in dry mode. The specifications vary according to the nature of the paint. Depending on the saturation and brightness of the color, we can have different specifications in wet and dry modes. The specification arbitrated is an average that covers at least 90% of all sample measurements. Approximately 300 batches were checked, and the result shows a normal distribution curve (Gaussian) behavior in the measurements by the equipment.Figures 4 and 5 show the comparison of the samples among the approved batches by the wet mode and respective dry mode. A histogram confirming the normal distribution and a graph of the capability of the process is also included. The special cases detected (or outliers) in the process are the colors that might be approved with broader specification. Because of the restricted specifications for some colors, it is not possible to calculate Cp and Cpk of the process (capability indexes) in this global analysis.
If necessary, some colors will have special specifications with the dry specifications also checked. Once the approval tolerances for each paint are specified, it is possible to maintain the process in statistical control, making a special evaluation for each restriction.
According to the statistical control of the process, it is possible to say that all the colors approved in the wet specifications will also be approved in the dry specifications. Thus, based on the similarity of the wet data and dry data, it is not necessary to check the dry specifications of a batch when corrected by the Colorcell wet system.
Figures 6 and 7 show comparative graphs of the process capability. The normal distribution can be observed.
Conclusion
The wet correction system in batch mode, as well as the continuous process mode, guarantee the quality of the produced colors. Using the wet correction system in batch mode, it is possible, based on the historical database of previous corrections, to reformulate the initial batch to minimize the number of corrections to only one batch running or approve the initial batch (first run).Compared to the conventional process, the wet correction system is faster and more efficient, because it is not necessary to wait for the drawdown and dry time of the samples to evaluate the color and consequent corrections to a standard specification. The system is automated, reducing the variability possibilities when compared to the dry standardization system mode.
After the wet Colorcell process in batch mode is fully implemented, it is possible to easily upgrade to the on-line process, using the same reading cell and the same database of color standards. Based on the results obtained we can comfortably say that the Colorcell wet mode test methods can be applied to paint production. The possibilities for applications also include other coatings such as paper, cosmetics, Kaolin, inks and other colored liquids.
References
1 www.continuousprocess.com.br
2 Malhotra, G.; Peixoto, C.A.; Schotgues, E.; and Pfeil, P.R. In-line Measurement and Correction of Color and Physical Properties. Symposium on Color and Appearance Instrumentation, April 15-16, 2003, Chicago, IL.
Looking for a reprint of this article?
From high-res PDFs to custom plaques, order your copy today!


