Application of the General Linear Model to Determine TiO2 Product Differences at Various Powder Coatings Film Thicknesses
Powder coating film thickness differences become difficult to control, due to the nature of spray application methods and lack of free flow during the thermal curing process. While a conventional liquid coating will flow and self-level after application to the substrate surface and during curing, a powder coating is limited to flow only during the thermal curing process. Even then, the flow is much more restricted than a conventional liquid coating. Many coatings manufacturers have developed procedures to reduce the effects of this issue. However, film thickness differences in powder coatings still play a role in the final coated product performance. Film thickness differences within a powder coating panel are also larger than those encountered in conventional coatings. Variations in film thickness make comparisons between powder coatings at a constant film thickness difficult and sometimes impossible. Some methods applied to powder coatings, although suited to the needs of the industry, may not give the coatings manufacturer the same level of quantification that can be found in other areas of coatings manufacture.2
It has been well documented that many coatings properties depend on film thickness and surface uniformity, particularly optical properties.3-5 Hence, the need to evaluate coatings performance properties at constant film thickness. Production limitations encountered in powder coatings make obtaining multiple panels at a constant film thickness extremely challenging. However, powder coating product comparisons are still desired. Therefore, a more realistic approach to this issue is to use statistics to aid in powder coatings product comparisons. By using some basic statistical relationships, the coatings formulator can feel more confident regarding comparisons between products. This work provides a brief review of several statistical techniques that can aid the formulator in evaluating TiO2 product differences. The statistical models that will be touched upon are linear correlation analysis, linear regression analysis and the general linear model. Based upon the type of data that is being analyzed in this study, the general linear model is readily applied to the data and is the desired method to determine TiO2 product differences in a typical powder coating. However, it should be noted that there are various other statistical methods that can be successfully applied to this type of data.
Experimental Procedure and Data
In this work, the powder coating formulation (Table 1) was prepared following a standard process of pre-mixing, dispersing using a twin-screw extruder, grinding and sieving extrudate to obtain dry powder coating product. Then, the product was spray applied to Q-type panels and cured in an oven at 200 °C for 10 minutes. The TiO2 type was changed so that comparisons could be made between TiO2 products.
For each pigment sample, multiple panels were prepared and evaluated for optical properties. In this study, we will only concentrate on L* versus film thickness for two samples, A and B.
Linear Correlation Analysis
Linear correlation analysis is a very useful method to determine the degree to which two random continuous variables are correlated.6-8 (Continuous variables can be thought of as being analogous to points on a string while discrete variables are like steps on a ladder.) Through a correlation coefficient, which is a measure of the strength of the linear relationship between two variables, one can determine the degree to which an input variable, x, is correlated to a response variable, y. One of the most widely known correlation coefficients is the Pearson correlation coefficient, r. The Pearson correlation coefficient ranges from -1 to +1, and the larger the correlation coefficient r, the stronger the linear relationship between the x and y. A positive value for r implies a positive correlation, while a negative value for r implies a negative correlation. It is interesting and important to note that when r equals 0, there is no linear relationship between the x and y variables.
Simple Regression Analysis
Simple linear regression analysis, or the method of least squares, is used in many applications. Linear regression analysis seeks to understand the relationship between two continuous variables.6-8 In simple regression analysis, a linear equation is developed from the relationship between an input variable, x, and response variable, y. The regression equation, will give the predicted response value of y for a given input value of x. All information regarding the linear relationship between the x's and the y's are given by the equation for the line. Simple linear regression analysis can also be defined by the correlation coefficient r, but more importantly, by the coefficient of determination, r squared. The coefficient of determination gives the degree to which the response variable y's variability, is explained by its linear relationship with the input variable x. The larger the r squared value, the stronger the relationship between the x and y variables. R squared ranges between 0 and 1, with 1 being the maximum. In general, if the value of r squared is greater than 0.7, then the relationship is considered strong.
Residuals, although not the main focus for simple regression analysis, are important. All information regarding the linear relationship between x and y are in the equation for the line, while the ‘leftover' information is captured in the residuals. The residuals identify inadequacies in the regression equation. Residuals are the difference in the actual response y value and the predicted y value from the regression equation. Before accepting the regression equation, residuals should be examined to validate the claim that the residuals are indeed just random variables. What is the ‘leftover' information? This could include information about non-linearity, random variation and other sources of error. Typically, the residuals can be determined and plotted to confirm that they are random, normally distributed and do not show any time dependency, if appropriate. If the residuals do not follow these conventions, the regression equation may be inadequate, and there may be other x's that can be used to predict y or the relationship between x and y is nonlinear.
General Linear Model Analysis
The general linear model is based on both correlation and regression analysis.9 As with the other two models mentioned, the general linear model also tries to establish a linear relationship between input variables, x and a response variable y. However, in this model, there may be multiple x variables that may be used to understand the linear relationship between the response variable and the input variables.This model can also handle both continuous and discrete input variables. In correlation and regression analysis, the input and response variables should all be continuous. The general linear model input data (the x's), may also be linearly dependent. Therefore, this model not only handles mixed input data types (continuous and discrete), it can also show input data interactions. In the general linear model, as in the regression model, the strength of the relationship between the x and y variables can best be described by the r squared value, the coefficient of determination. The larger the r squared value, the stronger the relationship between the x and y variables. Again, r squared ranges between 0 and 1, with 1 being the maximum.
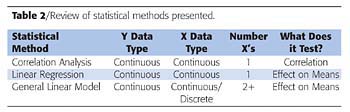
The output from the general linear model is similar to an analysis of variance (ANOVA) table. It may be useful to summarize the methods presented in this paper. Therefore, Table 2 (page 37) gives a quick summary of the statistical methods discussed.

Linear Correlation Model Application
The data can be analyzed using any basic statistical software. For this example, the data was analyzed using the Minitab® program.9 First, the L* data for each sample was plotted versus the corresponding film thickness. Results are given in Figures 1 and 2 (page 37). In this case, L* for both sample A and sample B are highly correlated with film thickness. Sample A has r = 0.884 and sample B has r = 0.837. Correlation analysis for both sample A and sample B show the P-value < 0.05. When the P-value is <0.05, this implies there is a statistical evidence of a strong positive linear relationship (correlation) between L* and film thickness. From this analysis, it can be seen that L* for both sample A and B are correlated to film thickness, but the differences between the products are not clear.
Regression Model Application
Again, it is important to note this data was analyzed using the Minitab program.9 The regression analysis of the L* data for each sample was plotted versus the corresponding film thickness. Results are given in Figures 3 and 4 (page 38).From the simple linear regression analysis, a predictive regression equation was obtained for L* at different levels of film thickness for each sample. Now, it seems relatively simple that these two regression equations can be used to determine pigment sample differences. L* values can be calculated for each sample based upon a determined film thickness. Then, L* values for each sample at the determined film thickness could be compared. However, the answer is not quite this simple.
If just the regression equations alone were used to determine differences in the sample, random errors associated with the equations could not be ruled out. Therefore, more analysis would need to be done. The standard error of the estimate would need to be calculated for both regression curves and then compared using another statistical tool to determine if the L* values were different due to the samples or just due to random error. This is a complicated analysis and is beyond the scope of this paper.

General Linear Model Application
Again, the data was analyzed using the Minitab program.9 The general linear model data table analysis is given in Figure 5 (page 40). The model shows that both grade and film thickness are factors that affect L*. When the P-value is <0.05, this implies that there is statistical evidence of a relationship between L* and both film thickness and grade.From the Analysis of Variance (ANOVA) table, the coefficient and constant terms can be used to develop predictive equations for L* for each pigment sample. Predictive equations can be developed for both L* versus film thickness and either sample. Or, more importantly, a generalized equation can be developed that includes both samples.
Now, it is useful to get the predictive equation based upon the coefficient terms given in the ANOVA table (Figure 5). Sample A will be denoted 1, while sample B will be denoted (-1), and film thickness will be denoted (FT). A general equation is given by:
L* (A,B) = 94.1728 +0.12130*(Sample A) + 0.12310 (-Sample B) + 1.03854*FT.
Summary and Conclusions
Due to the variation in powder coatings film thickness, statistical techniques are readily applied to powder coating performance data. Correlation analysis does give some information regarding the linear relationship between L* and film thickness for each sample tested. However, it does not give a predictive equation to understand that relationship. Regression analysis provides predictive equations regarding the relationship between L* and film thickness for each sample tested. However, simple linear regression analysis does not provide the complete picture. More statistical analysis needs to be done to understand whether or not the values for L* obtained at a set film thickness are truly dependent on TiO2 product differences or due to random error. This is a highly complicated analysis and beyond the scope of this paper.General linear model provides a complete analysis of the data and a means to develop a general equation that can be used to relate film thickness and TiO2 sample to L*, in the same relationship. The general linear model also readily handles the mixture of both continuous (film thickness) and discrete (sample A and B) data in the same analysis. Therefore, for this work, the general linear model is the best choice to analyze the data.
In this example, the authors concentrated on performance differences found in optical properties given by two different TiO2 products. However, one could imagine applying the same statistical methods to other powder coatings performance properties such as chemical resistance given by different binder systems. And as such, it may be beneficial to analyze the data using the general linear model.
Acknowledgements
The authors thank Robert Shiffer and William DeCostanza for generating the data for this work. Thanks also go to Dave Schussler, Marian Henze, Brian Sullivan and Michael Diebold for providing statistical guidance. And finally, the authors wish to thank Carlos Verdejo, Global Coatings Offering Manager, and Hendrik Dekoster, Technical Service Manager Europe, and DuPont Titanium Technologies for their continued support.This paper was presented at the 8th Nürnberg Congress, Creative Advances in Coatings Technology, April 2005 in Nürnberg, Germany. The Congress is sponsored by FPL, PRA and the Vincentz Network
References
1 Bocchi, G.J. Product Finishing 1987, April.2 Federation Series on Coatings Technology, Powder Coatings, 1991, October. Blue Bell, PA.
3 Standard Test Methods for Measuring the Hiding Power of Powder Coatings, ASTM Method 6441-99a 1999.
4 Parfitt, G.D. Dispersion of Powder in Liquids With Special Reference to Pigments. Applied Science, London.
5 Reck, E.; Marron, J.J.; Balfour, J.G.; Moulton, D. Parameters affecting the optical performance of powder coatings. Powder Coatings 1994, November.
6 Daniel, W.; Terrel, J. Business Statistics for Management and Economics, 7th Ed., Houghton Mifflin Company, Boston, MA.
7 Box, G. E.P.; Hunter, W.G.; Hunter, J.S. Statistics for Experimenters: An Introduction to Design, Data Analysis, and Model Building, John Wiley and Sons, New York, New York, 1978.
8 Kiemele, M.J.; Schmidt, S.R.; Berdine, R.J. Basic Statistics: Tools for Continuous Improvement 4th Ed, Air Academy Press, Colorado Springs, CO., 2000.
9 Ryan, B.; Joiner, B.L. Minitab Handbook, Fourth Edition, Duxbury, 2001.
Due to the dependence of optical properties on powder coating film thickness, regression and correlational analysis methods are aptly applied to powder coatings to evaluate product performance. While correlation analysis seeks to determine the strength of the linear relationship between two variables, regression analysis tries to determine a relationship between variables, which may or may not be linear in nature. Regression and correlational methods are the basis and key to understanding the general linear model. Therefore, this paper seeks to provide a brief review of several statistical techniques and to highlight the general linear model as the desired method to determine TiO2 product differences in a typical powder coating.
Looking for a reprint of this article?
From high-res PDFs to custom plaques, order your copy today!


