Aliphatic Polyurea Coating Systems
Their Network Formation and Influencing Factors

In recent years, polyurea coatings have become increasingly popular due to their interesting properties: mechanical resistance, durability, fast curing, etc. Therefore, they can be used for many applications, from marine to building construction. Much research has been pursued to improve these properties and to obtain tailored coatings for specific requirements (processing in wet environments or cold areas) by changing the formulations.
The structure of their network must be studied to improve the properties of polyurea coatings. For example, the degree of crosslinking, the chemical groups present, the molar mass, or the hydrogen bond formation are parameters playing a key role in the final properties of the polyurea coating. Therefore, these parameters need to be controlled to obtain the suitable properties.
The market trend is increasingly focused on reducing volatile organic compounds. It led to the proposal of various solutions: aqueous dispersion or solvent-free product formulation. In addition, sustainability and productivity improvements are also highly considered.
In this context, Vencorex wished to optimize formulations for coatings. However, the properties of some of the new formulations were not stable over time and it is necessary to understand the evolution of their structure after processing to identify the reactions at stake.
The present study had multiple objectives, including understanding, and characterizing the evolution of properties through time, studying model systems to understand the mechanisms by NMR, and testing various formulations to see their structure's effect on the coatings' properties.
Materials
Polyisocyanates used for Synthesis of Polyurea Networks
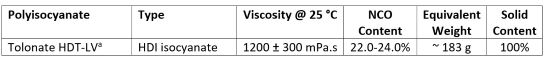
In this work, various polyurea networks (PUR) are synthesized. The synthesis of these polymers results from the polyaddition reaction between a diamine and a polyisocyanate. The polyisocyanate used in this project is Tolonate™ HDT-LV supplied by Vencorex.
TABLE 1 | Used polyisocyanate.
Aspartic Esters
Aspartate esters are low reactivity hindered secondary type of diamines used to synthesize PUR networks in reaction with polyisocyanates. Only one aspartate ester will be considered in this work, but this component will be provided by two different manufacturers.
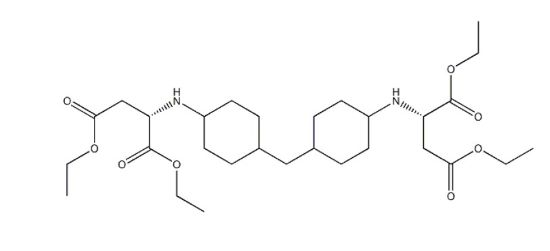
Amicure® IC-221 from Evonik and Feispartic® F420 from Feiyang are two aspartate esters composed of the same reactive molecule (Figure 1). It is commonly used for the synthesis of polyurea coatings. The presence of cycles and ester chain ends allows a sufficiently large pot life for industrial applications.
FIGURE 1 | Aspartic acid, N,N-(methylenedi-4,1-cyclohexanediyl)bis-, tetraethyl ester CAS: 136210-30-5, M=554,7 g/mol.
The difference between the two components provided by two manufacturers lies in the NH content present of the resins (Table 2).
TABLE 2 | Used amine resins and their NH-content.

According to the safety data sheet, impurities can come from diethyl fumarate resulting from the isomerization of diethyl maleate used to synthesize the aspartate ester. However, it represents only 1 to 2.5 wt% of the total product.
The NH content of a pure aspartate ester would be (15*2)/554.7 = 5.4%. Therefore, the mass ratio of impurities in Amicure IC-221 is 26%. The mixture contains, therefore, more than only the diethyl fumarate as impurities. It can be supposed that there are some additives in the amine. On its SDS it is specified that 25.25% of the mixture contains ingredients with unknown acute toxicity.
In this study, different aspartate-based PUR networks (PUR) are synthesized in presence or not of a surfactant with some acidic groups, using different polyisocyanates or esters aspartates (cf. Table 3). The acidic groups were present in a molar ratio of one for 27 mols of NCO groups.
TABLE 3 | PUR network compositions.
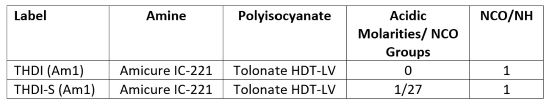
The aspartate-based PUR networks are synthesized by reacting the polyisocyanate and an amine at stoichiometry (NCO/NH=1) to avoid any residual reactive functions left in the system.
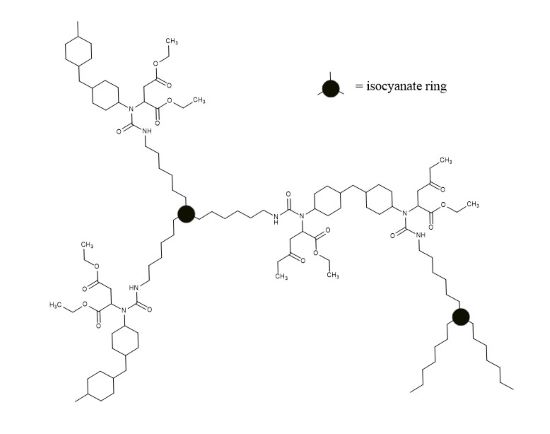
The functionality of Tolonate HDT-LV (> 3) leads to the formation of a crosslinked polyurea by polyaddition with Amicure IC-221 (bridging agent) (Figure 2).
FIGURE 2 | Hypothetical scheme of a THDI (Am1) network.
Properties of PUR Networks and their Evolution
Upon the synthesis of these systems, we have noticed that the mechanical properties of the networks synthesized based on Tolonate HDT-LV and those containing in addition some acidic molarities were evolving with time. The PUR networks seemed to soften on different timescales. After about 40 days, the mechanical properties of a PUR network containing acidities seemed stable while the ones for a network prepared without acidities slowly changed.
Networks with mechanical properties evolving over time are referred to as “fresh”, and those where changes have already been observed as “aged”. Therefore, THDI-fr (Am1) refers to an aspartate-based PUR network from Tolonate HDT-LV and Amicure IC-221, where the properties may vary, and THDI-ag (Am1) to one where the properties are supposed to be stable over time.
The two types of PUR networks are characterized with different experimental techniques: Fourier Transform Infrared spectroscopy (FTIR), Dynamical Mechanical Analysis (DMA), Differential Scanning Calorimetry (DSC) and Thermogravimetric Analysis (TGA), to understand the influence of the acidities on the crosslinking and the molecular architecture of the networks. It is evidenced that an additional reaction is taking place within the two networks during synthesis and aging. This reaction leads to the formation of ethanol which stays trapped in the networks. The presence of acidic moieties catalyzes this reaction, allowing it to occur at room temperature after 40 days. Within an acidity-free network, this reaction could take place at room temperature but for very long times (two years).
Following this reaction, many physical properties are evolving: reduction of the glass transition temperature (Tg), increase of the strain at break, etc. But the decrease of the Tg could not only be explained by the ethanol trapped within the network and acting as a plasticizer. Indeed, once the ethanol is removed, the Tg is still different from the one before the reaction.
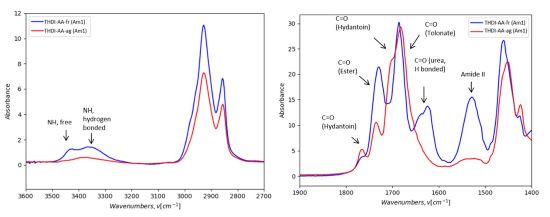
Moreover, the disappearance of the absorption bands at 1529 cm-1 and 1623 cm-1 in the FTIR spectra following the reaction confirms the destructuring of urea groups. This reaction involves phenomena that the performed characterizations and analyses cannot explain. Therefore, it is necessary to turn to model systems to understand this reaction happening within the networks.
Mechanisms Studied with the Help of Model Systems
The insoluble nature of the previously studied networks prevented the investigation of the structures by NMR analysis. To better understand the chemical mechanisms at work in the network model systems with lower functionalities have been synthesized to avoid polymerization and allow to solubilize the reacted system.
Two model systems are investigated, a model mono urea and a model mono urea-ester, both in presence and absence of acidic moieties. For verification that these model systems exhibit the same phenomena as the precedingly studied system THDI-S (Am1), they are analyzed by FTIR, DSC and TGA-IR to verify if:
- the decrease of the absorption bands at 1528 and 1623 cm-1 while two others appear at 1701 and 1765 cm-1;
- an exothermic peak followed by an endothermic one appears close to 100 °C;
- a loss of mass occurs at 111 °C results from the release of ethanol.
As monofunctional aspartic acid ester diethyl 2-(cyclohexylamino) succinate (CHAS) has been synthesized by the addition reaction of Aza-Michael between diethyl maleate and cyclohexylamine without any solvent or catalyst for 12 h at 50 °C under mechanical stirring (Figure 3). This molecule corresponds to half of the main component of Am1 the Aspartic acid, N,N-(methylenedi-4,1-cyclohexanediyl)bis-, tetraethyl ester (cf.: Figure 1).
FIGURE 3 | Synthesis of the model N-modified aspartic acid ester CHAS by Aza-Michael addition.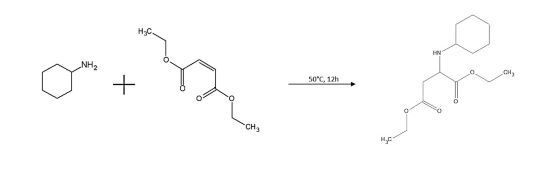
The purity of the synthesized CHAS has been verified by NMR analysis, showing that it contains 8.2% of impurities corresponding to diethyl fumarate (7.2%) resulting from the isomerization of diethyl maleate and residual cyclohexylamine (1%).
The model mono-urea (Figure 5) is obtained by the reaction of cyclohexylisopropylamine (141.25 g/mol) and n-heptyl isocyanate (141.21 g/mol) (Figure4) in stoichiometric conditions.
FIGURE 4 | Molecule of cyclohexylisopropylamine (left) (M=141.25 g/mol) and n-heptyl isocyanate (right) (M=141.21 g/mol).
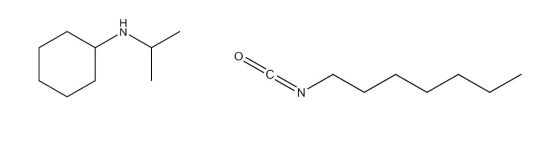
FIGURE 5 | Molecule of 1-cyclohexyl-3-heptyl-1-isopropylurea (Model mono urea) (M=282.46 g/mol).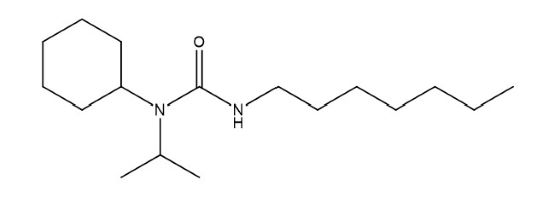
The strongly exothermic reaction between the isocyanate and the amine led to a white solid. In a second step an acidic moiety is added to the mixture to study its influence. The molar ratio of NCO groups to acidity is [NCO]/[H+] = 30.
The FTIR analysis in ATR mode of this mono urea in presence and absence of acidities did not reveal any differences in the spectra over time. The absorption bands characteristic of the urea group are observed. At 1526 cm-1 and 1616 cm-1 testifying the presence of NH-C=O (Amide II) and C=O (urea) groups, as well as at 3550cm-1 corresponding to the NH groups. The TGA-IR analysis confirmed the absence of any degradation peak or departure tied to ethanol. However, the system is almost completely degraded at 198 °C. The DSC thermogram shows for the first ramp a melting peak at 76 °C, but no other enthalpic variation.
The NMR analysis of this model system proved its purity, having no resonance signals due to residual heptyl isocyanate or cyclohexylisopropylamine in the spectrum of the mono-urea system. The analysis of the mono-urea helps to analyze the NMR spectra of the mono-urea ester.
The mono-urea esters are obtained by the reaction of a stoichiometric mixture of diethyl 2-(cyclohexylamino) succinate (CHAS) with heptyl isocyanate (Figure 6).
FIGURE 6 | Synthesis of the model urea-esters.
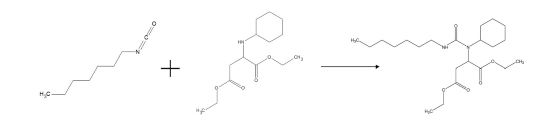
Unlike the mono-urea system, the synthesis of this system is not exothermic. The mixture being initially a yellow liquid, becomes after a few hours at room temperature a brittle white solid. Similarly, the mono-urea ester is also synthesized in presence of acidities, forming after a few hours a white solid. However, the white solid becomes after a few days at room temperature a yellow viscous liquid.
It is possible to draw a parallel between the white solid, the yellow liquid, and the THDI-S (Am1) networks. Therefore, the white solid represents the THDI-S-fr (Am1) while the yellow liquid represents the THDI-S-ag (Am1).
The FTIR spectra of the model mono-urea esters highlight absorption bands like those observed on the spectrum of the mono urea. An absorption band at 3350 cm-1, indicating the presence of NH groups linked by hydrogen bonds, can be evidenced. Two absorption bands at 1610 cm-1 and 1547 cm-1 testify to the presence of C=O (urea) and NH-C=O (Amide II) groups. The absorption band at 1731 cm-1 is due to the presence of ester groups.
The model mono-urea esters + acidic moieties are not stable over time. Just after the synthesis, it is expected to be a molecule containing urea groups. But, over a few days, the system evolves at room temperature. The presence of the surfactant induces fast reactions in the reactive system. The model mono-urea esters + acidities fresh refers to the system just after synthesis (between t=0 and t=24 h). A model mono-urea esters + acidities refers to the system beyond 24 h.
The absorption band at 1608 cm-1 separates into two distinct bands (1608 cm-1and 1644 cm-1), showing the presence of carbonyl involved in hydrogen bonding (ordered and disordered). After 72 h, the two bands are no longer distinguishable. (Figure 7)
FIGURE 7 | Comparison of FTIR spectra of model mono-urea esters + acidities 24 h after synthesis (blue) and 72 h after synthesis (red) (room temperature, ATR-IR).
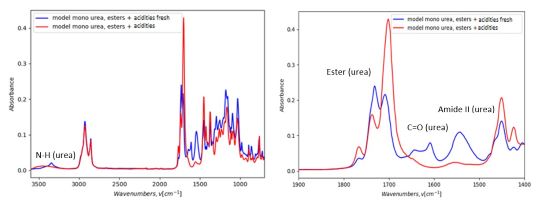
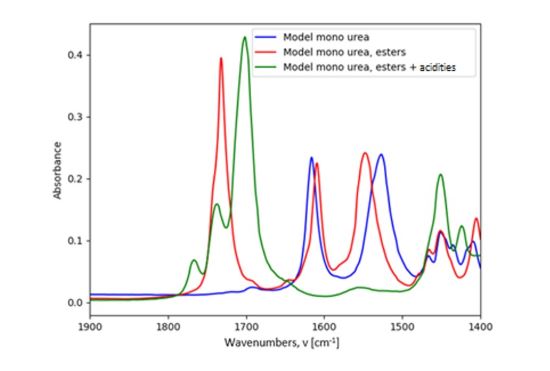
The FTIR spectra of the different model systems can be compared (Figure 8). A decrease of the absorption bands at 1610 and 1527 cm-1 and the appearance of those at 1701 cm-1 and 1765 cm-1 can be evidenced. Those phenomena are characteristic of the reaction happening in the THDI-S (Am1) and the THDI (Am1) networks.
FIGURE 8 | Comparison of FTIR spectra of the model mono-urea, the model mono-urea esters, and the model mono-urea esters + acidities (room temperature, ATR-IR, 1400-1900 cm-1).
TGA-IR analysis of the model mono-urea esters with and without acidities (fresh) confirm that the mechanisms induced by the acidities in the model mono-urea esters are the same as those observed for THDI-S (Am1). The fresh model mono-urea ester with acidities shows at 108 °C about 11% weight loss which corresponds to ethanol, confirmed by the coupled IR analysis.
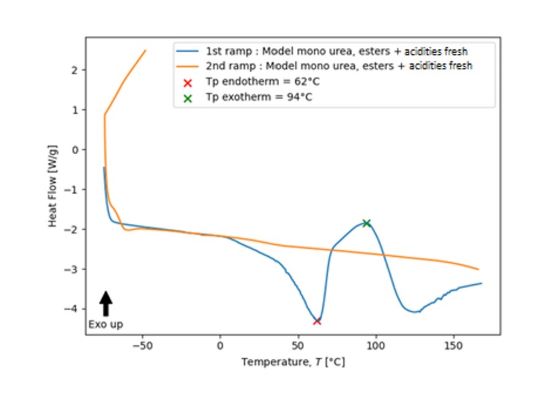
The DSC thermogram of the fresh model mono-urea esters with acidities shows an endothermic peak at 62 °C. However, an exothermic peak (94 °C) followed by an endothermic one (125 °C) are present on the thermogram. During the second ramp, none of those variations can be observed (Figure 9). The DSC analysis of the fresh model mono-urea ester with acidities evidences that the same phenomena occur in this model as within the THDI-S (Am1) network.
FIGURE 9 | Differential scanning calorimetry analysis of a model mono-urea esters + acidities fresh (10 K.min-1, under nitrogen, at t < 24h).
The model mono-urea ester behaves like the THDI-fr (Am1) system while the model mono-urea ester with acidities can be compared to the THDI-S-ag (Am1) system.
The structure of the model mono-urea esters allowed to correlate with that of the THDI-fr (Am1) and THDI-S-fr (Am1). In contrast, the model mono-urea esters with acidities helped to understand the structure of the aged THDI (Am1) and THDI-S (Am1). The combination of TGA, DSC, and FTIR analyses have shown that this reaction also occurred within these systems.
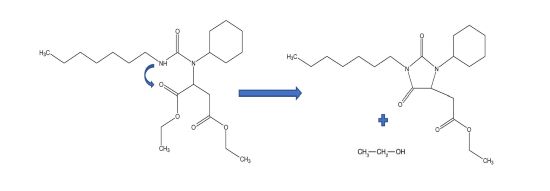
The NMR analyses of the model compounds proved that ethanol is trapped inside the final network and the disappearance of one of the esters is not due to ester hydrolysis. The Heteronuclear Multiple Bond Coherence (HMBC) analysis highlighted the formation of hydantoin 1-37 by reaction between an ester group and a urea group (Figure 10).
Therefore, this reaction also occurs within the THDI-based networks and could explain the changes in mechanical properties observed over time.
FIGURE 10 | Hydantoin formation mechanism in THDI (Am1) and THDI-S (Am1).
Kinetics of the Network Construction
Hydantoin groups are generated in THDI (Am1) and THDI-S (Am1) networks by reaction between urea and ester groups leading to the release of ethanol in the network. Only the time required to form the hydantoin groups varies.
To better control the formation of hydantoin, the parameters influencing the reaction are studied. Many factors can influence the kinetics, such as acid catalysis, annealing, film thickness, or the humidity content. Controlling those parameters is, therefore, important to understand the kinetics of hydantoin formation.
Chemical Catalysis
It is assumed that the acidity of the surfactants trapped in a THDI-S (Am1) network catalyzes the formation of hydantoin. Other acids have been tested to highlight chemical catalysis by an acidic agent. The networks were synthesized at stoichiometry of NH- and NCO-groups in presence of one mol of acidic groups for 27 mol of NCO-groups.
The example of such a network with acetic acid THDI-AA (Am1) show as like other THDI networks, it is possible to distinguish the THDI-AA-fr (Am1) containing urea groups and the THDI-AA-ag (Am1) containing hydantoin groups (Figure 11).
FIGURE 11 | FTIR spectra of THDI-AA-fr (Am1)(blue) and THDI-AA-ag (Am1) (red) networks (Room Temperature, ATR-IR).
TGA analysis evidence hydantoin formation in THDI networks. A significant degradation is observed with a maximum close to 108 °C and a total weight loss of 7% at 160 °C for THDI-AA-fr (Am1). As for THDI (Am1) network this degradation can be attributed to the release of ethanol. The temperature at which this degradation occurs changes slightly between THDI-S-fr (Am1) (112 °C) and THDI-AA-fr (Am1) (106 °C). This gives an indication of the kinetics of the hydantoin formation. DSC equally confirms the observations made for the THDI-S (Am1) networks.
Therefore, using the surfactant or acetic acid as a catalyst does not change the final structure of the network.
The time required to form hydantoin gives a first insight in the effect of acid on its formation: 40 days for THDI-S (Am1) and THDI-AA (Am1) networks, whereas it takes approximately two years for THDI (Am1) networks. These observations have been confirmed by NMR analysis following over time the hydantoin formation of mono-urea ester systems, synthesized from CHAS and heptyl isocyanate. The addition of acidic acid to the system accelerates the formation of hydantoin. A model mono-urea ester system with acidic acid added shows 10 hours after its synthesis most of the urea function have already reacted with the ester functions to form hydantoin groups, while for a system without acidic acid this conversion takes about seven days to be completed. However, in the case of THDI networks the kinetics may vary since the molecular mobility is much different. It can be expected that the conversion to hydantoin kinetics to be much slower.
Various acids have been considered to replace the initially used acidic surfactant: heptanoic acid, acrylic acid, nitric acid, and hydrochloric acid. They were all used corresponding to a ratio of [NCO]/[H+] = 40. With strong acids the crosslinking reaction is exothermic, and therefore the urea-hydantoin conversion very fast and almost immediately completed. However, since heat is a parameter accelerating the hydantoin formation its contribution is difficult to measure. Hence, it cannot be confirmed that hydantoin forms faster in presence of a strong acid than a weak acid. The same phenomena as for THDI-S (Am1) and THDI-AA (Am1) reactive systems can be noticed with the weak acids. It could be evidenced that with the concentration of the acids the catalytical effect increases.
TGA is a simple method to evaluate the rate of hydantoin formation. The temperature of the degradation peak associated with the ethanol emanation provides information about the time required to form hydantoin. For the THDI-S-fr (Am1) system with the acid surfactants catalyzing the reaction, a degradation peak is observable at 112 °C for the final network. While for the uncatalyzed THDI-fr (Am1) system this same peak is observed at 160 °C, indicating a higher activation energy. The observed ethanol departure temperatures are resumed in Table 4, including those for acrylic acid (THDI-AcA-fr) and heptanoic acid (THDI-HA-fr).
TABLE 4 | Ethanol emanation temperature (minimum in the derivative curve) depending on the acid compound used as catalyst.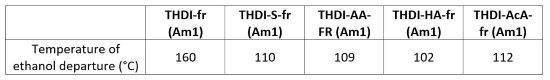
Physical Parameters Influencing the Reaction Kinetics
Determination of the Amount of Hydantoin Formed
The amount of hydantoin formed is estimated from the amount of evaporated ethanol in TGA experiments. Assuming that one molecule of ethanol is formed per urea function the maximum ethanol content of the THDI-S (Am1) system would be 7.9 wt% and 8.2 wt% for the THDI-fr (Am1). After the degradation peak mass losses of 8.1 wt% for THDI-S-fr (Am1) and 8.0 wt% for THDI-fr (Am1) are observed due to evaporation of ethanol. In contrast no degradation peak related to ethanol evaporation has been observed for the aged network in the THDI-S-ag (Am1) system, confirming that most of the urea groups had been converted to hydantoin groups during the aging.
Annealing Treatments
It has been observed that heating the networks accelerates the hydantoin formation. Therefore, annealing experiments at 40 °C and 70 °C have been conducted to study the changes in the hydantoin formation and calculate the activation energy of this reaction.
FTIR analysis of THDI (Am1) networks at different time of aging at 40 °C did not reveal any change of the network microstructures after 20 hours. In contrast, the THDI-S-fr (Am1) network showed a clear decrease over time of the intensity of the absorption bands at 1529 cm-1 and 1623 cm -1, and the appearance of absorption bands at 1701 cm-1 and 1765 cm-1. Hydantoin is formed after 22 hours at 40 °C in the THDI-S-fr (Am1) network.
The monitoring over time of the Shore A hardness at room temperature of the networks heated at 40°C showed no evolution of the THDI-fr (Am1) with values close to 95 Shore A, while for the THDI-S-fr (Am1) network the hardness starts to decrease from initial 95 Shore A after 5 to 10 hours and stabilizes after 20 hours at about 65 Shore A.
This hardness decrease can hence be associated with the formation of hydantoin.
At an annealing temperature of 70 °C the network reorganization kinetics accelerates for THDI-S-fr (Am1) and the evolution of the FTIR spectra is almost finished after 2 hours. For the THDI-fr (Am1) network hydantoin starts to form quickly and has completely formed after 22 hours. The Shore A hardness at room temperature of the networks showed upon annealing at 70 °C a faster decrease. Knowing that the Tg of the polymers is close to 50 °C and the aging is done at 70 °C the faster kinetics can be attributed to the higher molecular mobility of the polymer networks. Both networks reached a hardness of about 65 Shore A after 24 hours at 70 °C.
Consequently, the relationship between hydantoin formation and mechanical properties is established.
The activation energy for the hydantoin formation38 could be determined with the Arrhenius equation and the times required to form hydantoin at different temperatures. The times were determined by FTIR spectroscopy when the absorption bands tied to the formation of hydantoin, corresponding to C=O (urea) and C=O (hydantoin) no longer changed over annealing (Table 5).
Table 5 | Time required to form all the hydantoin groups in the THDI-fr (Am1) network depending on the annealing temperature (above Tg = 57 °C).

From the hydantoin formation in the THDI-fr (Am1) network an activation energy of 64 kJ/mol is obtained. So, the time needed to form hydantoin would be about 40 days at room temperature. However, the time needed to complete hydantoin formation at room temperature in the THDI-fr (Am1) network is much longer (2 years).
Influence of Residual Isocyanates
To understand the influence of the stoichiometry on the hydantoin formation. A network synthesized in large excess of isocyanate groups ([NCO]/[NH] = 70/30) shows that an excess of isocyanate groups slows down the formation of hydantoin. Urea groups are still well present after 40 days of aging at room temperature, while for an equivalent network at stoichiometry 1:1 ( THDI-S-fr (AM1) ) all urea is transformed to hydantoin. TGA-IR analysis shows the same degradation phenomenon that occurs in THDI-S-fr (Am1), however with a slightly higher degradation temperature for the system with the excess isocyanate (117 vs. 112 °C). 5% of weight loss is observed upon the emanation of ethanol. If all urea groups would be converted to hydantoin the total mass of released ethanol would correspond to 6.7% of the total mass. Therefore, it is possible that residual isocyanates can partially prevent the formation of hydantoin.
Influence of Humidity
Ambient humidity influences the kinetics of hydantoin formation. THDI-S (Am1) networks aged at room temperature under different humidity conditions, one at ambient humidity (circa 50% r.h.), the other in a desiccator containing silica gel reducing the humidity (to circa 15% r.h.). FTIR and DSC analysis after two months of aging showed that at ambient humidity aged sample the formation of hydantoin was completed, while that stored in the desiccator showed that the kinetics of hydantoin formation is slowed down. It is possible that water increases the mobility in the network, acting as a plasticizer and therefore facilitating the motion of the ester chains.
Relationship between Molecular Network Architecture and its Thermomechanical Properties
Study of Networks Synthesized with Am2
Am2 amine is used to synthesize new networks and to compare their properties to networks synthesized from Am1. The goal is to highlight the role of the additives in the network mechanical properties. THDI (Am1) networks refer to polymers synthesized from Amicure IC-221, while THDI (Am2) refers to networks synthesized from the reactive amine Feiyang F420.
After synthesis, noticeable differences can be seen macroscopically. The adhesion to a glass plate of the networks synthesized from Am2 looks stronger, the films are more fragile, and no exudate is visible after annealing.
After synthesizing THDI (Am2) and THDI-S (Am2) network with a 1:1 stoichiometry, residual isocyanate is present after 48 h as evidenced by the presence of an absorption band at 2270 cm-1.
Therefore, THDI-S (Am2) networks are synthesized with NCO: NH ratios of 1:1.05, 1:1.1, 1:1.2, 1:1.3, and 1:1.4. These are followed by FTIR spectroscopy for 48 hours.
The THDI-S (Am2) network spectra does not vary between 24h and 48 hours. It can be noticed that the absorption band indicating the presence of residual isocyanate decreases with the addition of more and more reactive amine. From the stoichiometry 1:1.3, the amount of residual isocyanate stays very low.
The presence of residual isocyanate while being at NCO/NH stoichiometric ratio could be due to poor accessibility of NH functions. Therefore, for the network syntheses with Am2, a NCO/NH stoichiometric ratio of 1:1.3 is chosen to ensure that all the isocyanate reacts. Indeed, it was previously seen that residual isocyanate have an influence on the urea/hydantoin conversion kinetics. So, it is essential to synthesize networks where all the NCO functions have reacted. But, on the other hand, it should be noted that residual reactive amine can also react and form hydrogen bonds, therefore, having an influence on the formation of hydantoin.
The additives present in Am1 may improve the crosslinking and reduce the viscosity of the reactive amine. Indeed, according to the SDS, the viscosity of Am2 is 1100 ± 200 mPa.s against 400 ± 300 mPa.s for the Am1. This lower viscosity can have an effect during crosslinking.
TGA of THDI-S-fr (Am2) and THDI-fr (Am2) networks show that the temperature of the degradation peaks and the mass losses associated can be compared with those of the networks synthesized with Am1. TGA highlights the same degradation peak at 110 °C and 162 °C for THDI-S-fr (Am2) and for THDI-fr (Am2), respectively. This phenomenon confirms the formation of hydantoin. Furthermore, following this degradation, a loss of mass of 8% is quantified, which shows that most urea functions are converted into hydantoin.
DSC analyses performed on THDI-fr (Am2) and THDI-S-fr (Am2) networks, show that the networks behave similarly to that synthesized with Am1 during the first heating ramp.
Regarding THDI-S-fr (Am2) network, a Tg of 46 °C is evidenced. The presence of exothermic and endothermic peaks indicates the formation of hydantoin at 107 °C. For the THDI-fr (Am2) network, a Tg of 56 °C is evidenced and enthalpic changes close to 140°C confirm the hydantoin formation. The main difference with THDI (Am1) networks lies with the phenomena occurring during a second heating. In all cases, the exothermic and endothermic peaks disappear, indicating that all urea functions have been converted into hydantoin during the temperature rise. So, the networks analyzed during the second run are polyhydantoins in both cases.
The Tg of THDI-S-fr (Am2) network is 63 °C during this second heating and that of THDI-fr (Am2) network is 69 °C. These glass transition temperatures are close to the temperatures obtained on the THDI-S (Am1) and THDI (Am1) networks after Soxhlet extraction (72-73 °C), where Tg increases after removing additives. By comparison, during a second heating ramp, the Tg of THDI-S-fr (Am1) network is 35 °C and the one of THDI-fr (Am1) network is 29 °C.
This experiment allows us to conclude that the additives play an essential role on the Tg of the network. In the first heating, the networks are in the "urea" form and additives seem to have a lower effect on the Tg of the network. However, when hydantoin forms (corresponding to the structure during a second heating), additives cause a decrease in Tg.
The hydantoin formation within the networks synthesized with Am2 is slower. It seems that the additives present in Am 1 facilitate the formation of hydantoin.
If the additives are plasticizers, as supposed after the NMR analysis, it may explain this acceleration. In aspartate-based polyurea networks made with Am1, it can be considered that the formation of hydantoin is accompanied by a decrease of the Tg. Therefore, it will accelerate the conversion by increasing the mobility in the system. Therefore, the more hydantoin is formed in these networks, the easier the conversion becomes.
In networks synthesized with Am2, the formation of hydantoin increases Tg. Thus, the more hydantoin is formed, the less mobility there is. Thus, the kinetics of hydantoin formation is different within the two types of networks.
Mechanical tests were conducted on THDI (Am2) and THDI-S (Am2) networks to study the effect of hydantoin formation on mechanical properties. Previously, it was seen via FTIR spectroscopy that THDI (Am2) and THDI-S (Am2) networks adopted a mostly hydantoin configuration after being heated at 50°C for seven days.
The networks were studied right after synthesis (majority of urea groups), after being heated to 50°C for 48 hours (mix of urea and hydantoin groups) and after being heated to 50°C for seven days (majority of hydantoin groups).
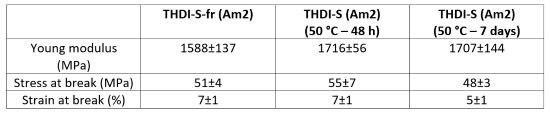
Tensile tests on the THDI (Am2) networks show that the annealing at 50°C has little effect on mechanical properties. The networks still have a high Young's modulus (approx. 1670 MPa), high stress at break (57 MPa), and low strain at break (6%) (Table 6).
TABLE 6 | Mechanical properties of THDI (Am2) networks (mean results, 50 mm.min-1, room temperature).

Similar observations can be made for the THDI-S (Am2) network. There is no change in the mechanical properties after the formation of hydantoin. A high Young's modulus and stress at break and a low strain at break are observed (Table 7).
TABLE 7 | Mechanical properties of THDI-S (Am2) networks (mean results, 50 mm.min-1, room temperature).
Study of the Parameters Responsible for the Softening of the THDI Synthesized from Am1
The formation of hydantoin leads to the appearance of ethanol within the network. The latter can act as a plasticizer, therefore, leading to a reduction in mechanical properties. To study the influence of ethanol, the THDI-S (Am1) network was synthesized and aged at room temperature. FTIR analyses confirm that during this time (approximately 40 days), hydantoin groups were formed.
First, tensile tests were carried out 24 hours after synthesis on the THDI-S-fr (Am1) network; after 40 days of aging, tensile tests were again carried out at 50 mm/min. The network was then placed at 50°C under vacuum for 24 hours to evaporate the ethanol and the same tests were carried out.
THDI-S-fr (Am1) network, still containing ureas, possesses a higher Young's modulus (940 MPa) compared to THDI-S-ag (Am1) network (20 MPa) which is composed of hydantoin and ethanol. Moreover, after removing the ethanol, the modulus increases to 656 MPa demonstrating that the ethanol has a strong influence on the network softening (Table 8).
Table 8 | Mechanical properties of THDI-S (Am1) network for 1 and 40 days of aging at room temperature before and after drying (50 mm.min-1, room temperature).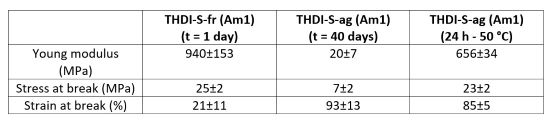
It is noteworthy that the stress at break is similar between THDI-S-fr (Am1) and THDI-S-ag (Am1) networks heated at 50 °C.
However, the strain at break of the THDI-S-ag (Am1) network does not seem to change much after drying. It decreases from 93 to 85% and remains much higher than the strain at break of THDI-S-fr (Am1) networks.
Once the network has been dried, a phenomenon of strain hardening can be evidenced on the stress-strain curve. The polymer chains are easily aligned when being stretched. The deformation is applied homogeneously in the network and not locally anymore. The more hydantoin forms, the more visible the hardening phenomenon becomes, and it allows the network to have a higher strain at break.
THDI-S-ag (Am1) network displays a Tgonset of 13 °C and a Tgmidset of 24 °C. Therefore, since the tensile tests are made at room temperature, the network behaves like an elastomer. By heating the network, ethanol is released and the Tgmidset increases up to 35 °C. This Tg is like that observed during the second heating of the thermogram THDI-S-fr (Am1) network. Thus, the tensile tests are carried out in the glassy state.
Similar mechanical tests have been conducted on the THDI-fr (Am1) network. Studying ethanol effect on the THDI (Am1) network is complicated as during such a long time (two years), ethanol evaporates at room temperature. Thus, the two phenomena compete. Therefore, the polymer does not behave like an elastomer and no decrease in the modulus can be evidenced from the fresh to the aged networks.
The network is analyzed after crosslinking and then aged at room temperature for two years. It is then heated to 50 °C under vacuum for 24 h to remove ethanol.
The results are quite like those measured on the THDI-S (Am1) network. The yield stress and Young's modulus of THDI-ag (Am1) (50 °C) network are lower than those of THDI-fr (Am1) one. The stress at break is also slightly lower (Table 9).
Finally, the strain at break is also much higher for THDI-ag (Am1) (50 °C) than that of THDI-fr (Am1).
TABLE 9 | Mechanical properties of THDI (Am1) network after drying (mean results, 50 mm.min-1, room temperature).
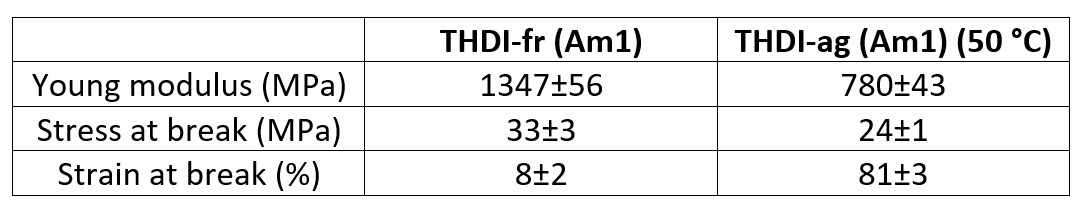
Therefore, the results confirm that the ethanol in the network plays a plasticizing role, i.e. reducing the Young's modulus and the stress at break. Furthermore, as the Tg also decreases, the tensile tests are conducted in a visco-elastic state.
Conclusions
This paper reports aims to understand the structure of polyurea coatings based on aspartate esters and to link with variations in mechanical properties observed over time. The networks synthesized from a specific reactive amine tend to soften over time, and this decrease in stiffness is even more rapid when acidic groups are added to the formulation.
Model systems representative of the networks are synthesized and analyzed by NMR. It allows us to put forward the formation of hydantoin by the reaction of the urea groups with the ester groups. It is seen that the presence of acid within the network accelerates this phenomenon. Then, the physical parameters allowing the acceleration of the hydantoin formation are studied, such as humidity, network mobility, and annealing. It is seen that by immersing the networks in a KOH solution, it is possible to reform urea groups, but as soon as the polymers are dried, the equilibrium tends again towards the formation of hydantoin.
An aspect of the work deals with the influence of hydantoin formation on mechanical properties. Initially, it is put forward that Am1 contains an additive that may be a plasticizer. The presence of this additive leads to an exudation phenomenon within the networks after annealing. Another reactive amine, Am2, without additive, is used. The networks synthesized in the presence of this reactive amine appear to present different properties after the hydantoin formation.
From these results, it has been shown that the evolution of mechanical properties depends mainly on two factors. On the one hand, the ethanol trapped in the network tends to plasticize it, which leads to a decrease in the Tg. On the other hand, the presence of the plasticizer within the reactive amine alters the mechanical properties. However, the interaction between the plasticizer and the network differs when the latter contains urea or hydantoin groups.
References
1 Cho, S.; Kim, S.-H.; Shin, D. Recent Applications of Hydantoin and Thiohydantoin in Medicinal Chemistry. Eur J Med Chem 2019, 164, 517–545.
2 Nishinami, S.; Ikeda, K.; Nagao, T.; Koyama, A. H.; Arakawa, T.; Shiraki, K. Aromatic Interaction of Hydantoin Compounds Leads to Virucidal Activities. Biophysical Chemistry 2021, 275, 106621.
3 Ware, Elinor. The Chemistry of the Hydantoins. Chem. Rev. 1950, 46 (3), 403–470.
4 Meusel, M.; Gütschow, M. Recent Developments in Hydantoin Chemistry. a Review. Organic Preparations and Procedures International 2004, 36 (5), 391–443.
5 Podešva, J.; Smrčková, M. D.; Trhlíková, O. Role derivátů hydantoinu při syntéze polyaspartátů. Chemické listy 2022, 116 (4), 215–222.
6 Bogolubsky, A. V.; Moroz, Y. S.; Savych, O.; Pipko, S.; Konovets, A.; Platonov, M. O.; Vasylchenko, O. V.; Hurmach, V. V.; Grygorenko, O. O. An Old Story in the Parallel Synthesis World: An Approach to Hydantoin Libraries. ACS Comb. Sci. 2018, 20 (1), 35–43.
7 Konnert, L.; Lamaty, F.; Martinez, J.; Colacino, E. Recent Advances in the Synthesis of Hydantoins: The State of the Art of a Valuable Scaffold. Chem. Rev. 2017, 117 (23), 13757–13809.
8 Kumar, V. Designed Synthesis of Diversely Substituted Hydantoins and Hydantoin-Based Hybrid Molecules: A Personal Account. Synlett 2021, 32 (19), 1897–1910.
9 Kalník, M.; Gabko, P.; Bella, M.; Koóš, M. The Bucherer–Bergs Multicomponent Synthesis of Hydantoins—Excellence in Simplicity. Molecules 2021, 26 (13), 4024.
10 Read, W. T. Researches on Hydantoins.Synthesis of the Soporific 4,4-Phenylethyl-Hydantoin (Nirvanol). J. Am. Chem. Soc. 1922, 44 (8), 1746–1755.
11 López, C. A.; Trigo, G. G. The Chemistry of Hydantoins. In Advances in Heterocyclic Chemistry; Katritzky, A. R., Ed.; Academic Press, 1985; Vol. 38, pp 177–228.
12 Stella, V.; Higuchi, T. Kinetics of the Acid-Catalyzed Closure of Hydantoic Acids. Effect of 2-Aryl and 2-Alkyl Substituents. J. Org. Chem. 1973, 38 (8), 1527–1534.
13 Baltrushis, R. S.; Beresnevichyus, Z.-I. G.; Vizgaitis, I. M.; Gatilov, Yu. V. 1-Aryl-5-Carboxymethylhydantoin Derivatives. Structure of 1-Phenyl-2-Thio-5-Carbomethoxymethylhydantoin. Chem Heterocycl Compd 1981, 17 (12), 1226–1231.
14 Kaválek, J.; Macháček, V.; Svobodová, G.; Štěrba, V. Kinetics of Acid-Catalyzed Cyclization of Substituted Hydantoinamides to Substituted Hydantoins. Collect. Czech. Chem. Commun. 1987, 52 (8), 1999–2004.
15 Kaválek, J.; Macháček, V.; Svobodová, G.; Štěrba, V. Base Catalyzed Cyclization of Substituted Esters of Hydantoic and Thiohydantoic Acids. Collect. Czech. Chem. Commun. 1986, 51 (2), 375–390.
16 Macháček, V.; Svobodová, G.; Štěrba, V. Kinetics and Mechanism of Base-Catalyzed Cyclization of Substituted Amides and Nitriles of Hydantoic Acid. Collect. Czech. Chem. Commun. 1987, 52 (1), 140–155.
17 Olimpieri, F.; Bellucci, M. C.; Volonterio, A.; Zanda, M. A Mild, Efficient Approach for the Synthesis of 1,5-Disubstituted Hydantoins. European Journal of Organic Chemistry 2009, 2009 (35), 6179–6188.
18 Farrissey, W. J.; Alberino, L. M.; Sayigh, A. A. R. Polymers from Unconventional Reactions of Isocyanates. Journal of Elastomers & Plastics 1975, 7 (3), 285–313.
19 Imai, Y. Aromatic Polyhydantoins from Bisiminoacetate and Diisocyanates. J. Polym. Sci. A-1 Polym. Chem. 1967, 5 (9), 2289–2296.
20 Imai, Y. A New Class of Polymer Derived from N.N.N’.N’-Ethylenediaminetetraacetic Acid Dianhydride and Diamines. Makromol. Chem. 1970, 138 (1), 293–297.
21 Tejero, R.; Lozano, Á. E.; Álvarez, C.; de Abajo, J. Synthesis, Characterization, and Evaluation of Novel Polyhydantoins as Gas Separation Membranes. J. Polym. Sci. Part A: Polym. Chem. 2013, 51 (19), 4052–4060.
22 Santi, E.; Babé, S. G.; Fontán, J. Polyhydantoins from Glutamic Acid. J. Polym. Sci., C Polym. Symp. 2007, 42 (1), 39–50.
23 Volonterio, A.; Ramirez de Arellano, C.; Zanda, M. Synthesis of 1,3,5-Trisubstituted Hydantoins by Regiospecific Domino Condensation/Aza-Michael/O→N Acyl Migration of Carbodiimides with Activated α,β-Unsaturated Carboxylic Acids †. J. Org. Chem. 2005, 70 (6), 2161–2170.
24 Caracciolo, P. C.; Buffa, F.; Abraham, G. A. Effect of the Hard Segment Chemistry and Structure on the Thermal and Mechanical Properties of Novel Biomedical Segmented Poly(Esterurethanes). J Mater Sci: Mater Med 2009, 20 (1), 145–155.
25 Caracciolo, P. C.; de Queiroz, A. A. A.; Higa, O. Z.; Buffa, F.; Abraham, G. A. Segmented Poly(Esterurethane Urea)s from Novel Urea–Diol Chain Extenders: Synthesis, Characterization and in Vitro Biological Properties. Acta Biomaterialia 2008, 4 (4), 976–988.
26 Kleinpeter, E. The Structure of Hydantoins in Solution and in the Solid State. Struct Chem 1997, 8 (2), 161–173.
27 Pretsch, E.; Bühlmann, P.; Badertscher, M. Structure Determination of Organic Compounds: Tables of Spectral Data, 4th, rev.enl. ed ed.; Springer: Berlin, 2009.
28 Attanasi, O. A.; Crescentini, L. D.; Favi, G.; Nicolini, S.; Perrulli, F. R.; Santeusanio, S. 1,3,5-Trisubstituted and 5-Acyl-1,3-Disubstituted Hydantoin Derivatives via Novel Sequential Three-Component Reaction. Org. Lett. 2011, 13 (3), 353–355.
29 Merten, R. Carboxylic Acid Ester Substituted Polyhydantoins. US3549599A, December 22, 1970.
30 Jonsson, E. H.; Yeske, P. E.; Wicks, D. A.; Pielartzik, H. Thermoreversible Coating and a Process for Its Manufacture. CA2174195A1, November 25, 1996.
31 Dyer, E.; Hartzler, J. Preparation of Polyhydrouracils and Polyiminoimidazolidinones. J. Polym. Sci. A-1 Polym. Chem. 1969, 7 (3), 833–849.
32 Pojarlieff, I. G. Kinetics of Cyclization of 3-Ureidopropionic Acid to Dihydrouracil in Hydrochloric Acid. Tetrahedron 1967, 23 (11), 4307–4315.
33 Bhusainahalli, V. M.; Rescifina, A.; Cardullo, N.; Spatafora, C.; Tringali, C. Bio-Activated Intramolecular Anti-Aza-Michael Addition: Stereoselective Synthesis of Hydantoin Derivatives. New J. Chem. 2018, 42 (22), 18348–18357.
34 Packman, L. C. N-2-Hydroxy-4-Methoxybenzyl (Hmb) Backbone Protection Strategy Prevents Double Aspartimide Formation in a ‘Difficult’ Peptide Sequence. Tetrahedron Letters 1995, 36 (41), 7523–7526.
35 Quibell, M.; Turnell, W. G.; Johnson, T. Synthesis of Azapeptides by the Fmoc/Tert-Butyl/Polyamide Technique. J. Chem. Soc., Perkin Trans. 1 1993, No. 22, 2843.
36 Johnson, T.; Quibell, M.; Owen, D.; Sheppard, R. C. A Reversible Protecting Group for the Amide Bond in Peptides. Use in the Synthesis of ‘Difficult Sequences.’ J. Chem. Soc., Chem. Commun. 1993, No. 4, 369–372.
37 Liley, M.; Johnson, T. Solid Phase Synthesis of Azapeptides Utilising Reversible Amide Bond Protection to Prevent Hydantoin Formation. Tetrahedron Letters 2000, 41 (20), 3983–3985.
38 Antonik, S. Détermination Expérimentale de l’énergie d’activation d’Arrhénius d’une Réaction. Bulletin de l’union des physiciens 1987, No. 698, 1123–1141.
Looking for a reprint of this article?
From high-res PDFs to custom plaques, order your copy today!


