The Purchase Price of a Pump is Becoming Less Important

Due to the worldwide price increase of raw materials, pumps have become more expensive in the past 2 years. However, energy prices in Europe have risen much faster. We have calculated different situations and in each case the share of the initial purchase price in the Total Cost of Ownership (TCO) has fallen spectacularly over the past 2 years.
We calculated, based the purchase price of the pump from 2 years ago and with an energy price of €0.2/kWh, how long it took for the pump to consume its own value in energy. For pumps running 40 hours per week, this ranged from 2 to 2.5 years for smaller pumps and to less than 1 year for large pumps. The graph below shows the initial investment and the annual energy consumption (at 40 and at 100 operating hours per week) for a series of pumps that each have to deliver 4 bar head, but at a different flow rate.
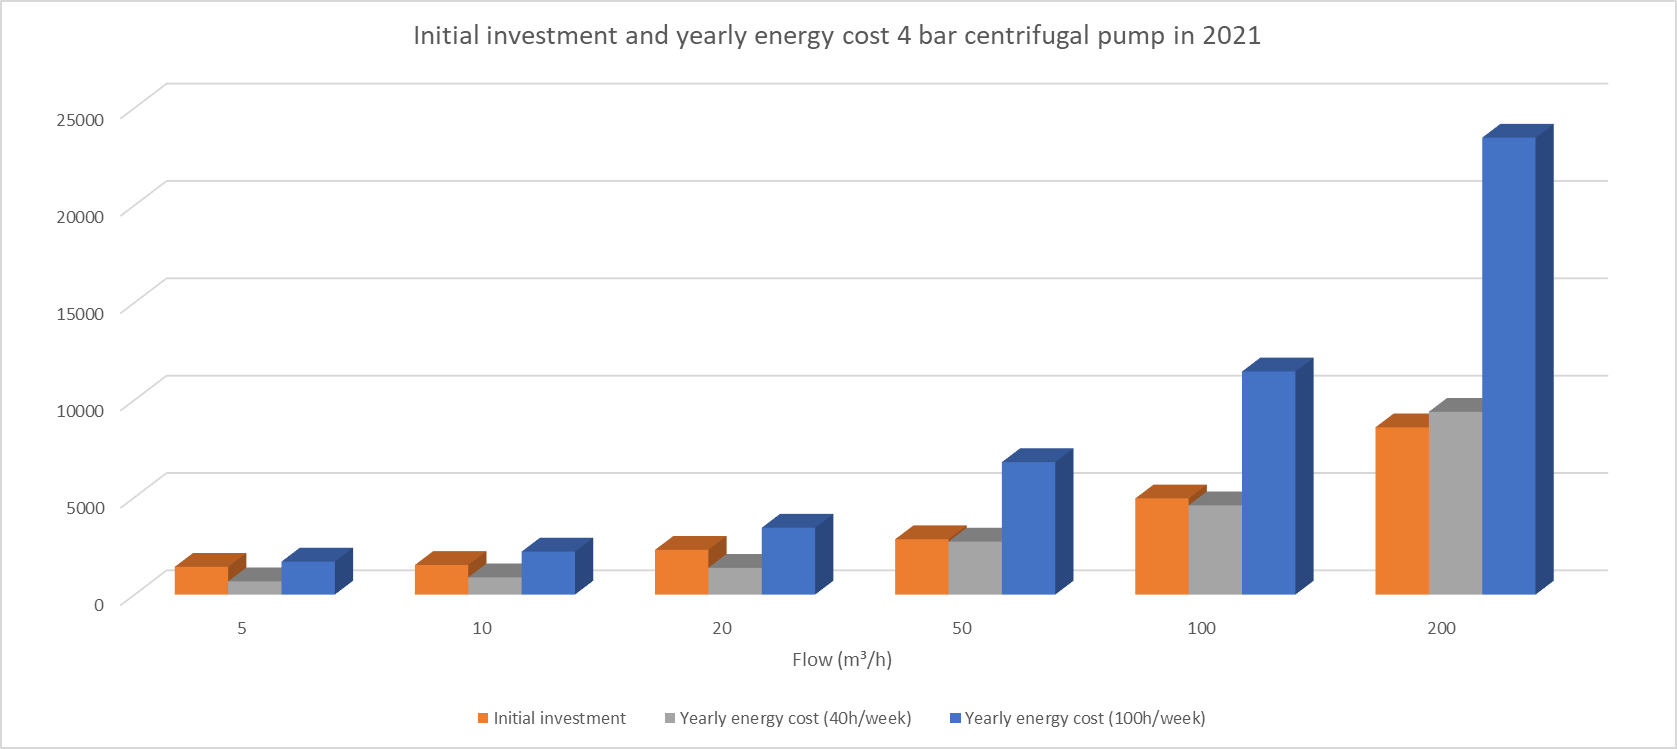
With today's purchase prices for the same pumps and an energy cost of €0.4/kWh (which is still conservative), a pump often consumes its own energy cost within 6 months. The same graph 2 years later now looks like Figure 2.

At Packo, we have done a lot of research over the past 15 years to increase the energy efficiency of our pumps, and it has been one of the main points of attention for all newly developed pumps ever since. The flow in the pump is examined in detail via CFD (Computational Fluid Dynamics) analyses. Subsequently, parameter studies are carried out on the geometry of the impeller vanes and the pump housing in order to arrive at the most energy-efficient design. Today we can say that we have a range of hygienic centrifugal pumps with one of the highest, if not the highest energy efficiency, on the European market.
In addition to a sound hydraulic design of the pump, an optimal selection also determines the height of the energy bill during the life of the pump. Packo developed an advanced pump selection package that gives you an overview at a glance of the initial investment and energy consumption depending on operating point, viscosity, number of operating hours per week, etc., both with an IE3 and IE4 motor.
The graphs below show the importance of the initial investment and energy consumption for a pump that has to deliver 50 m³/h at 4 bar. The first graph shows the investment and energy costs in 2021, the second shows the situation at the beginning of 2023. The blue and orange bars show the evolution of the TCO for a Packo pump. The gray and yellow bars show the same evolution for a pump that costs 10% less at the time of purchase, but is (only) 5% less energy efficient.

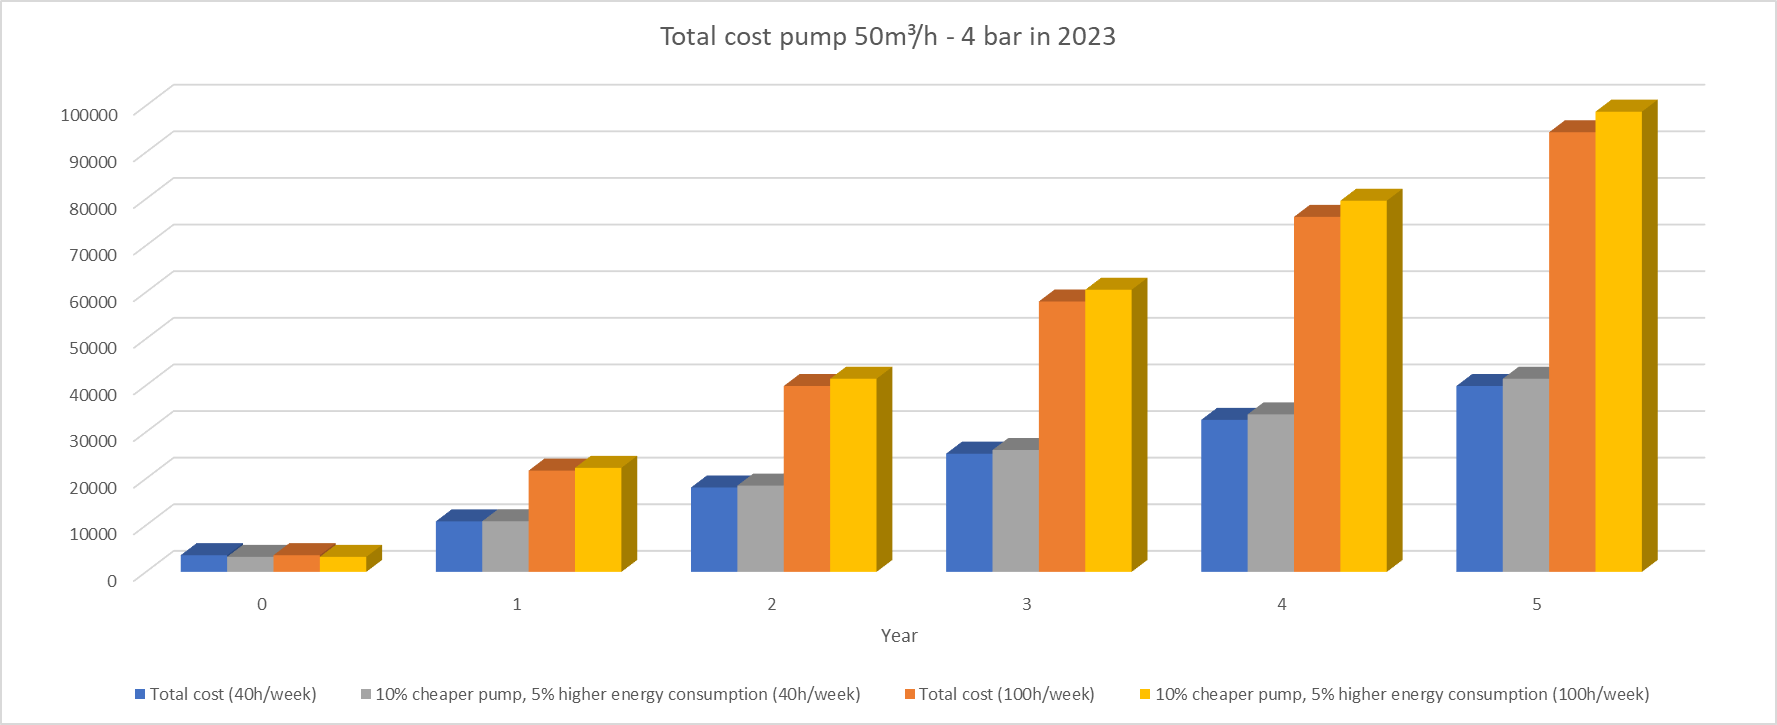
The comparison of these graphs clearly shows that the purchase price of a pump becomes even less important in 2023, but its energy efficiency all the more. A pump that is 10% cheaper to purchase, but consumes 5% more electricity, costs just as much as the more expensive pump after a year of use at only 40 hours per week. For all subsequent years, you pay the difference in purchase price to your energy supplier every year. If the pump is used 100 hours per week, the difference is much more pronounced.
Looking for a reprint of this article?
From high-res PDFs to custom plaques, order your copy today!