Revisiting and Questioning the AMS-C-27725 Iron Chloride Resistance Test

The objective for this exploratory study on the Resistance to Iron Chloride Test specified in AMS-C-27725 (Coating, Corrosion Preventative, for Aircraft Integral Fuel Tanks for Use to 250 °F (121 °C)) was to get a better understanding on a possible rationale behind this corrosion test required for the aircraft integral fuel tank coating systems. This test employs a high-voltage direct current (DC) resistance measurement technique to measure the coatings’ electrical insulating resistance after being immersed in a 0.5% (by weight) ferric chloride (FeCl3) solution for 10 days at 60 °C. After immersion, the coatings are first examined visually for blisters or loss of adhesion, and then the electrical resistance is measured and is required to be at least 5.0 megohms per mil coating thickness. In recent years, this test has been in question for its relevancy as a valid measure of corrosion resistance performance. The concern is that there is no clear understanding of the test method itself and the specified requirement. The test was first implemented in early 1960s and has remained in the specification ever since with only minor changes over the years.
The study was conducted under the assumption that the test in its current version represents an accelerated corrosion resistance test for assessing barrier protection properties of integral fuel tank coatings. It was confirmed that the ferric chloride solution undergoes a fast hydrolysis reaction that makes the solution highly acidic; this rapid change in acidity is believed to be a predominant factor in accelerated coating degradation. Various factors affecting the iron chloride resistance test were investigated, including the determination of drying rate for the coatings after immersion in the test solution, and the solution chemistry of ferric chloride. A chemically stable alternative solution was proposed and tested for use in the accelerated corrosion test and as a replacement for the inherently unstable colloidal ferric chloride solution. In all these steps, the electrochemical impedance spectroscopy (EIS) method was investigated as an alternative analytical technique for the direct current resistance method (Table 1).
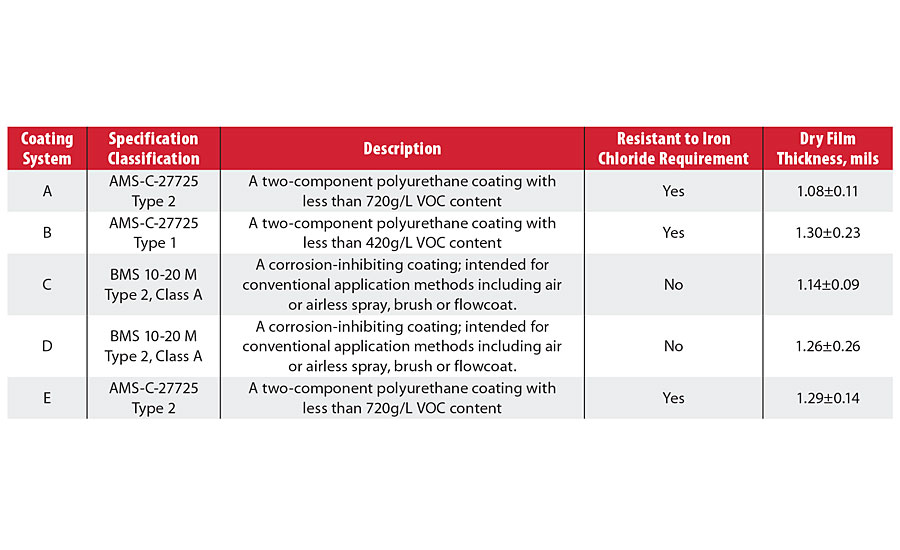
TABLE 1 » List of studied integral fuel tank coatings.
Hydrolysis and Solution Chemistry of Ferric Chloride
In order to better understand the corrosion aspects of the AMS-C-27725 Iron Chloride Resistance test for the fuel tank coatings, it was essential to look at the solution chemistry of the ferric chloride (FeCl3). In aqueous solutions, ferric chloride undergoes slow hydrolysis due to presence of Fe3+ ion and its hydrolysable nature:
The reaction described in the chemical equation is the initial stage of hydrolysis reaction when the metal ions become partially hydrolyzed by accepting the hydroxide ion from dissociated water molecules. The rate of this hydrolysis reaction is greatly dependent on solution concentration. Experimentally, it has been found that the 0.5% (by weight) ferric chloride solution, when prepared, is initially clear and stays clear at room temperature for a duration of approximately 7-10 days with the pH at approximately 2.0. After this initially slow reaction, the 0.5% ferric chloride solution turns to a cloudy colloidal solution with the eventual formation of the iron hydroxide precipitate.
According to published research on colloidal chemistry of ferric salt solutions,1 the hydrolysis of Fe (III) ions leads to the formation of various ferric hydrolysis species such as Fe(OH)2+, Fe(OH)2+, Fe(OH)3 and other more complex aggregates that soon lead to nucleation of colloidal particles and formation of the precipitate of iron hydroxide or a complex iron oxohydroxide.
The exact hydrolysis products are not always known, as the hydrolysis extent depends on different factors such as solution concentration, pH, temperature and the presence of various competing ions/additives that affect the reaction. In the most general form, the complete hydrolysis pathway can be simplified by the following equation to account only for the formation of iron (III) hydroxide, which is typically the principal product of the late stage hydrolysis reaction:
The importance of chemical reaction for the Iron Chloride Resistance test is that hydrochloric acid (HCl) is formed as a byproduct of this hydrolysis; according to this chemical equation, HCl is formed in the concentration three times higher than the initial molar concentration of iron chloride, thus making the immersion solution highly acidic and corrosive for an aluminum substrate.
Experimentally, we have found that at the conditions of the Resistance to Iron Chloride test specified in AMS-C-27725, namely at 60 °C and at 0.5% concentration of ferric chloride, the hydrolysis reaction has been accelerated as compared to room temperature conditions. The ferric chloride solution undergoes a hydrolysis reaction accompanied by a fast formation of colloidal particles and the eventual sedimentation of the iron (III) hydroxide precipitate, which covers the bottom of the beaker and the coated panels placed in the beaker for the duration of the test (10 days of immersion).
The pH measurements were performed using a series of small (25 mL) plastic containers simultaneously placed in the oven maintained at 60 °C. At a specified time, the individual containers were removed from the oven consecutively, cooled down rapidly to room temperature using cold water bath and then placed for measurements using an Accumet® AR50 pH meter.
By measuring the pH values in the ferric chloride solution over the duration in the oven at 60 °C, the substantial change in pH was observed as illustrated by the plot in Figure 1. The solution was initially stable for 30 min, and then the pH values started to decrease rapidly before leveling off at approximately 1.4, where the pH value was stabilized after approximately 20-24 hrs, indicating that the hydrolysis reaction reached its equilibrium. The hydrolysis was accompanied by the formation of colloidal particles as the initially clear solution rapidly became cloudy (within 1-2 hrs). The solution maintained its acidity with the pH ~1.4 for the remainder of the immersion time (10 days).
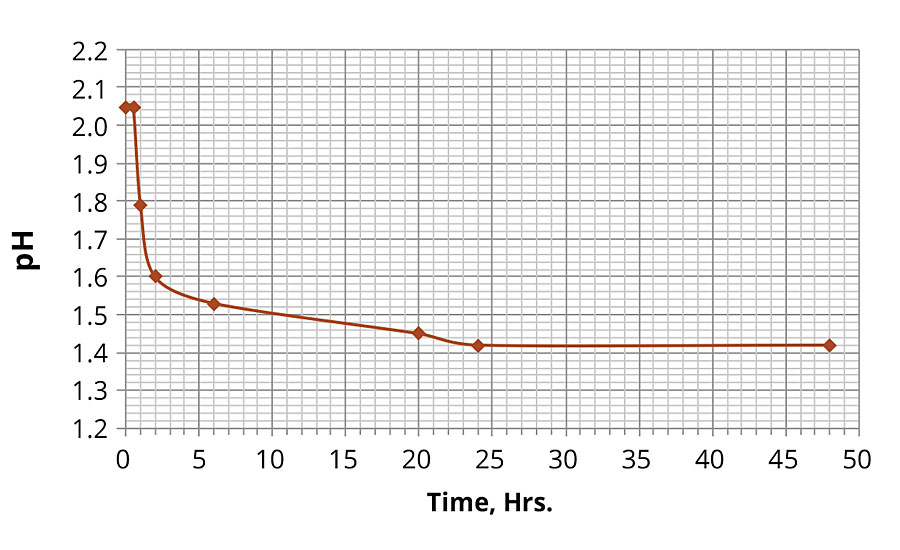
FIGURE 1 » Change in pH in 0.5% iron chloride solution over time at 60 ºC.
Application of Electrochemical Impedance Spectroscopy to Iron Chloride Resistance Test
The implementation of the EIS technique to the analysis of barrier properties and corrosion resistance of the coating systems is well established. EIS is a method of analysis of the electrochemical system’s response to an applied voltage sine wave, resulting in an alternating current (AC) and measured as a function of frequency. In its most complex form, the total impedance in an AC circuit can be a combination of various elements such as resistors, capacitors and inductors, all of which in electrochemical systems can be of certain physical origin; for example, a layer of absorbed ions on a metal surface immersed in a solution, pinhole defects of the coating film, oxide layer on a metal surface, resistance of an organic film itself, etc. Due to this complexity, evaluation of organic coatings can often be a difficult task. However, by means of the EIS analysis, it is possible to evaluate both more general barrier properties of the coatings as well as the specific mechanisms of degradation of a coating over time.
The EIS measurements were performed using a Biologic VMP-300 multipotentiostat (BioLogic Science Instruments, France) operated in a potentiostatic single sine mode with the applied 10 mV amplitude in the 0.01 Hz to 200 kHz frequency range. The measurements were performed in a standard electrochemical cylindrical glass cell clamped to a coated aluminum alloy (AA2024-T3) 3 x 6 inch panel to create a working electrode with 7 cm2 electrode surface area; a silver/silver chloride (4 M KCl) reference electrode and a platinum mesh counter electrode were used. Prior to EIS measurements, an open-circuit voltage was monitored for up to 30 min to establish sufficiently steady conditions with the drift of 5 mV per minute or less. Freshly prepared 0.5% ferric chloride solution was used for each test.
Figure 2 shows Bode plots of EIS spectra obtained for the tested coating systems after they have been immersed for 10 days in 0.5% iron chloride solution. The Bode plot format shows the absolute impedance as a function of frequency and represents the magnitude of impedance change over the whole range of applied frequencies. The Bode plot describes the resistive and capacitive components of a system as a function of frequency; resistance values appear as horizontal portions of the curve and capacitance values appear as diagonal portions of the curves. The comparison of the EIS spectra shown in Figure 2 illustrate the difference in barrier properties for two groups of the coating systems. The coating systems A and B exhibit strong corrosion protection properties, whereas the coatings systems C and E show noticeable weakening in their corrosion protection properties after immersion in the solution. Both systems A and B show almost linear response in impedance over the applied frequency range extending into a low-frequency region on the left. This type of behavior is representative of high barrier properties associated with the capacitive response for the typical defect-free polymer coating. The System B samples are just beginning to show a deviation from the linear capacitive resistance behavior and a formation of the horizontal plateau at the extreme low-frequency region, demonstrating some initial signs of weakening in corrosion protection properties. However, both A and B coating systems are very effective corrosion protection coatings since they show none or very little deviation from the typical strongly capacitive ideal-coating impedance response after such long exposure in the aggressive corrosive electrolyte.
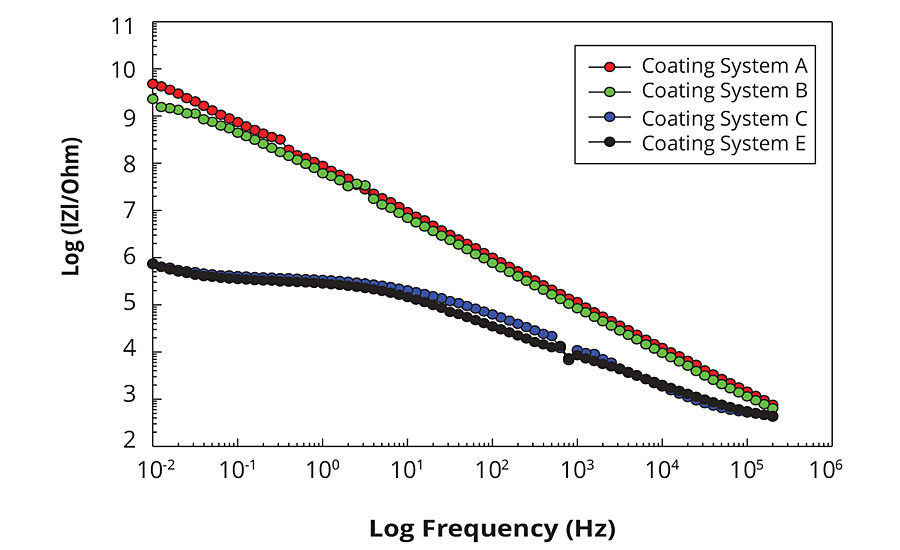
FIGURE 2 » EIS Bode plots for the tested coating systems (after 10 days immersion in 0.5% iron chloride solution).
For the systems C and E, the deviation from the linear impedance response have started already in the mid-frequency region, with the pronounced horizontal plateau developed in the low-frequency range, which is indicative of the resistive behavior due to the additional contribution of the pore/interfacial resistance and the coating deterioration.
In order to simplify the performance evaluation for different coating systems, the sampling of the impedance response data was also performed at single frequency of 0.1 Hz. This frequency point is in the low-frequency region of EIS spectrum, in which the impedance response is the most sensitive to coating degradation and allows for easy comparison between coating systems based on discrete impedance values. Mansfeld and Kendig (1988)2 have devised a damage function term as a characterization parameter, allowing for the comparative analysis between samples using differences in impedance values measured in the low frequency region:
Where |Z|0 represents the absolute impedance measured at 0.1 Hz of the sample prior to immersion in the test electrolyte for 10 days, and |Z|t represents the absolute impedance measured at 0.1 Hz after immersion in the test electrolyte for 10 days. Also, such a method of EIS data selection permits easy comparison of impedance values with the corresponding DC resistance data points.
Table 2 shows DC resistance and EIS impedance (extracted at single 0.1 Hz frequency) data obtained for the tested coating systems before and after the coated panels were immersed in 0.5% iron chloride solution for 10 days. With the exception of the system C, which showed a complete loss of the coating adhesion, all tested coating systems have demonstrated various degree of corrosion resistance, confirmed by both methods (DC resistance and EIS measurements).
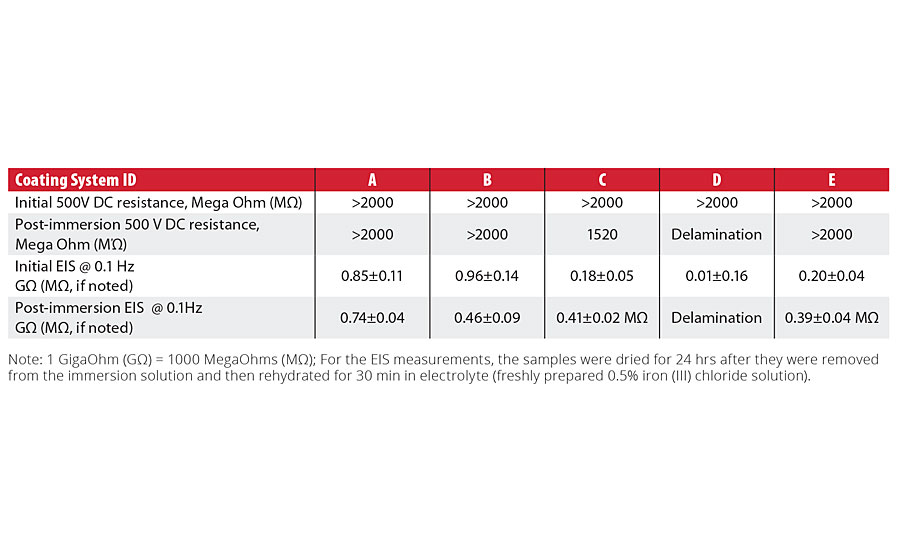
TABLE 2 » Comparison of DC resistance and EIS impedance in FeCl3 solution results.
For the initial immersion measurements for each coating system, immediate differences in the coating systems’ performance were clearly demonstrated, with the impedance values at 0.1 Hz ranging from 0.96±0.14 to 0.01±0.16 gigaohms. After the 10-day immersion in the ferric chloride test solution, the impedance values decreased from gigaohm to megohm values for Systems C and E. System D, which exhibited the lowest value in the initial EIS measurements, experienced failure and delamination at the end of the 10-day exposure.
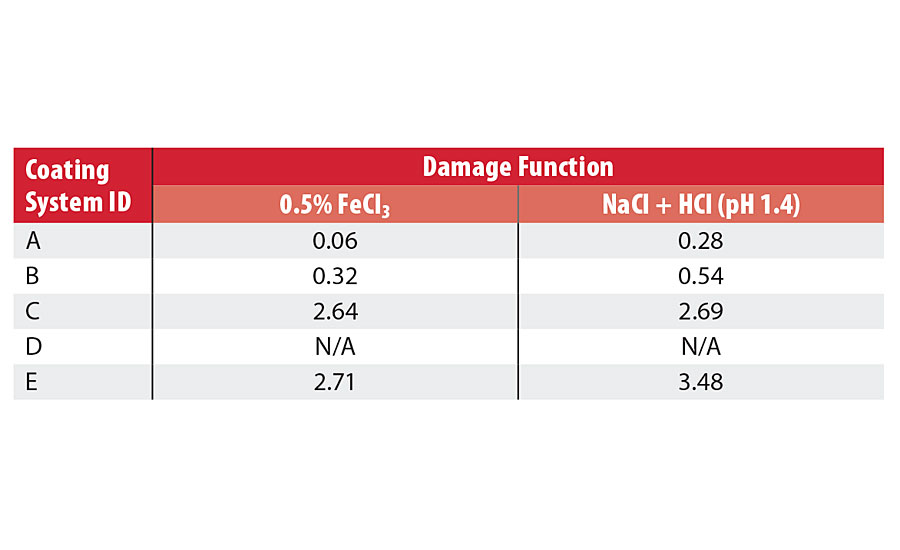
TABLE 3 » Damage function values for coating systems tested in FeCl3 or alternative solution.
As the data indicate, the EIS method demonstrated a much higher sensitivity in distinguishing between the barrier properties of the coatings. As the DC resistance data shows very high resistance for all coating systems tested before and after immersion experiments, the EIS clearly differentiates the two coating systems (A and B) with the lowest damage function values (higher barrier protection) from the two coating systems (C and E) with the higher damage function values and coating system D, which had the lowest initial impedance values at 0.1 Hz and subsequently exhibited complete failure due to the loss of adhesion and coating delamination. Table 3 contains the damage function values for the coatings tested in the FeCl3 solution; a subsequent ranking of the coatings is summarized below comparing the EIS damage function values (lower is better) vs. the DC resistance values (higher is better):
EIS (Df) values: System A< System B < System C < System E
DC Resistance values: System A= System B > System C >System E
It is clear that the EIS damage functions parameter was able to determine differences in the barrier property ranking between coating systems A and B, whereas the DC resistance technique was not.
Accelerated Corrosion Test with Alternative Immersion Solution
Once the pH value for the specific conditions of the ferric chloride test was established, it was possible to calculate the equivalent of hydrochloric acid (HCl) concentration necessary for the preparation of the alternative immersion solution with the same acidity of pH=1.4:
Because pH= - log [H+] and [H+] = 10-pH, for the pH=1.4, the concentration of HCl should be 0.04 M (mol/L).
In order to maintain the total concentration of Cl– ions at the level matching the chloride concentration in 0.5% ferric chloride solution, the solution contained 0.053 mol/L of sodium chloride, in addition to the amount of chloride supplied by hydrochloric acid. The solution of sodium chloride acidified with hydrochloric acid to pH=1.4 matched the fully hydrolyzed 0.5% ferric chloride solution in both chloride-ion content and acidity. The sodium (Na+) ions instead of Fe3+ ions should have no effect on corrosion acceleration.
The accelerated corrosion test with the alternative solution was performed similar to the Resistance to Iron Chloride test. The coated panels were immersed vertically in the acidified sodium chloride solution (pH=1.4) and placed at 60 °C for the duration of 10 days. After 10 days, the samples were removed from the solution, rinsed with DI water and dried at the ambient conditions for 24 hrs before either 500 V DC resistance or EIS testing were performed on the coating samples. Figure 3 shows a side-by-side comparison of the 0.5% ferric chloride solution and the chemically stable acidified sodium chloride solution after being in the oven at 60 ºC for 10 days.
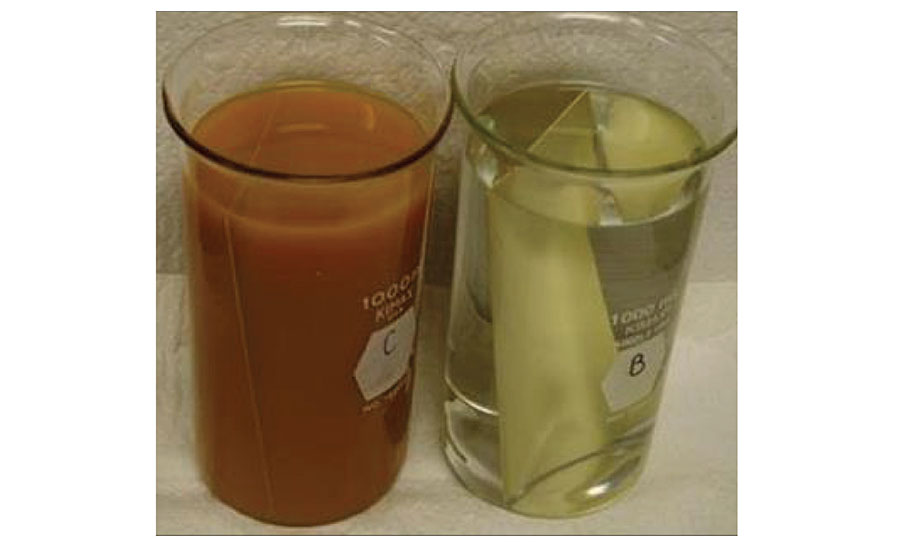
FIGURE 3 » Ferric chloride and acidified sodium chloride solutions after 10 days of samples immersion.
Table 4 shows DC resistance and EIS impedance data obtained for the tested coating systems after the coated panels were immersed in the acidified NaCl (HCl, pH=1.4) solution at 60 °C for 10 days. After the immersion period, System A showed no signs of blistering or adhesion loss; Systems B, C and E had a least one test panel out of the four coated panels with one or two small blister(s), again primarily on the edges, similar to the ferric chloride immersion test. System D showed severe blistering and delamination from the substrate, also similar to ferric chloride immersion and was excluded from both EIS and DC resistance measurements.
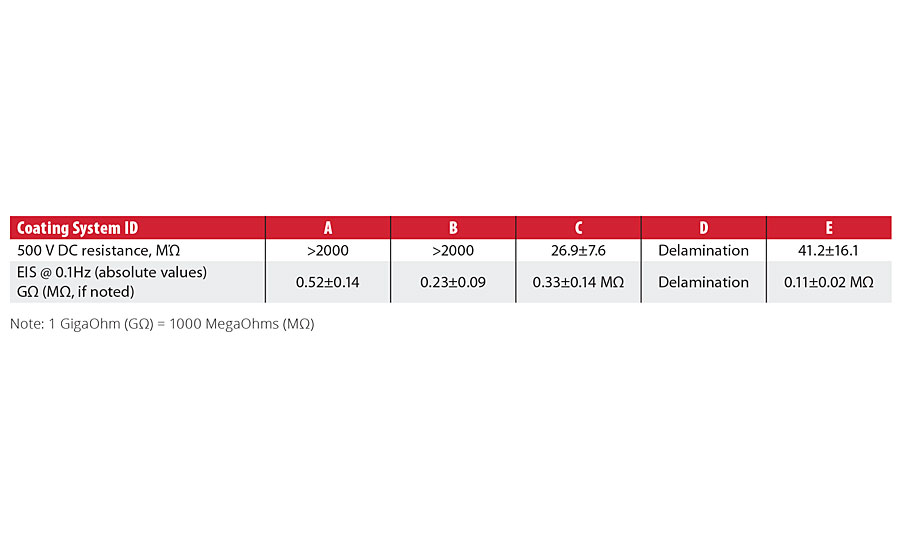
TABLE 4 » DC resistance and EIS impedance data for the tested coating systems after immersion in NaCl (HCl, pH=1.4) solution.
For DC resistance, Systems A and B exceeded the instrument maximum resistivity limit of 2000 MΩ. Systems C and E showed a significant decrease in resistance when tested. For the EIS data at 0.1 Hz, Systems A and B maintained impedance measurements in the gigaohm range, while Systems C and E showed a significant decrease in the absolute impedance.
The comparative analysis of the data shows a good agreement between DC resistance and EIS impedance measurements, indicating stronger corrosion resistance properties for Systems A and B, and weaker corrosion resistance properties for the Systems C and E.
Table 3 shows the damage function values for the coatings tested in the acidified NaCl solution. A subsequent ranking of the coatings is summarized below:
EIS (Df) values: System A< System B < System C < System E
Clearly, it can be seen that the rankings of the coating systems in the NaCl + HCl solution is identical to the rankings for the FeCl3 test solution, where the EIS damage function parameter was able to distinguish between system A and B in comparison to the CD resistance, which was not.
Conclusions
A multifaceted exploratory study was conducted on the Resistance to Iron Chloride Test specified in AMS-C-27725 to better understand the rationale of this corrosion acceleration test required for the integral fuel tank coating systems.
Within the study of solution chemistry of ferric chloride at the conditions of the Resistance to Iron Chloride test, it was found that the ferric chloride solution undergoes fast hydrolysis reaction that turns the solution highly acidic, making this a predominant factor in the acceleration of coating breakdown. A chemically stable alternative solution was proposed and tested for use in accelerated corrosion testing and as a replacement for the inherently unstable ferric chloride solution. The alternative immersion solution was made of sodium chloride with the addition of hydrochloric acid (pH=1.4) to emulate the ferric chloride solution and to match it in both acidity and the chloride content. Both solutions were tested in the same manner as the ferric chloride immersion test accompanied by a comparative data analysis.
In the overall comparison between DC resistance and EIS impedance data, the EIS damage function parameter was found to be more sensitive in revealing the degradation of the barrier protection properties of the coatings. In general, however, both techniques were found to be in good agreement in the overall ranking of the corrosion protection properties of the coating systems when the alternative acidified sodium chloride solution was used for the immersion test.
More work is needed if the EIS technique is to be considered for inclusion in the AMS-C-27725-specified procedure for testing the coatings’ corrosion resistance performance and to establish a pass/fail requirement for the integral fuel tank coating systems.
Acknowledgements
This work was sponsored by the U.S. Air Force Laboratory (AFRL), Materials & Manufacturing Directorate, Materials Durability & Sustainment Branch, Coatings, Corrosion & Erosion Laboratory and the Office of the Secretary of Defense (OSD) under contract number FA8650-11-D-5602.
References
1 Pham, N.A.; Rose, A.L.; Feitz, A.J.; Waite, T.D. Kinetics of Fe(III) Precipitation in Aqueous Solutions at pH 6.0-9.5 and 25°C. Geochim. Cosmochim. Acta 70:640-650 (2006).
2 Mansfeld, F.; Kendig M. Evaluation of Anodized Aluminum Surfaces with Electrochemical Impedance Spectroscopy. J. Electrochem. Soc. 135(4):828-833 (1988).
Looking for a reprint of this article?
From high-res PDFs to custom plaques, order your copy today!


