Novel Polysiloxane Enhancing Polymer
Performance Comparison to Existing Technology


According to the Merriam-Webster Dictionary, enhancement is to heighten or increase. Enhancing technologies were developed to impart a “wet-look” appearance to cementitious and mineral-based substrates. Wet-look enhancement is intended to provide a lasting, water-soaked appearance. Enhancing materials intensify existing substrate color and aesthetic appeal by making subdued tones and colors brighter.
Enhancing materials are either water- or solvent-based. The solvent-based materials often have superior enhancing properties, but are flammable and contain high VOCs and other health or environmentally detrimental materials. On the other hand, water-based materials alleviate these concerns but historically do not perform as well as their solvent-based counterparts.
Enhancement is the primary desired performance attribute. The easiest way to determine enhancement is to measure the change in lightness in any color space.1 Performance is measured with the L* or light-dark scale using the CIE-L*a*b* color space. The “L” Scale is a 100 point scale, with zero representing absolute dark or black, and 100 representing absolute light or white.2
Other important performance characteristics are stain repellency, weathering and abrasion resistance. This enhancing technology was designed to penetrate the surface and bond with the substrate, as well as to penetrate within the substrate to offer increased environmental protection. Stain repellency is important for any sealer or enhancing material to protect the substrate from chemical attack. All data was collected and published in two separate papers at the 41st and 42nd Annual Waterborne Symposiums.3,4 This article evaluates relative enhancement, weatherability and stain repellency testing as a function of both abrasion and weathering to determine the impact of these deleterious environmental conditions.
Some silicone enhancing materials utilize amino-functional polysiloxanes, which are known to suffer from yellowing upon storage. Part of the focus of this development was to produce a non-yellowing amino-functional-containing polysiloxane. This non-yellowing product was achieved through the use of specific reactions, conditions and production techniques.5 The generalized structure of the polymer is represented in Figure 1. It appears to be a simple polysiloxane, however it is the amount and distribution of each of the various organic substituent groups that gives this polymer its unique properties. The success of this technology lies in the control of the specific ratio of functional mono (M), di (D) and tri (T) units within the polysiloxane backbone, which also contributes to this polymer’s unique performance properties.
Methods and Materials
Test Methods
Three main testing evaluation protocols were utilized in this study:
1. Enhancement as measured by a change in the L* or lightness value.
2. Weathering as monitored by change in the L* or lightness value, using QUV and exterior exposure panels.6
3. Stain repellency focusing on household food-type staining agents:7
a. under standard conditions;
b. after surface abrasion;
c. after accelerated QUV weathering.
Manufacturers’ label instructions were followed regarding the amount of material to be used, number of coats, residence time of coating (if any), time between re-coats (if any) and minimum cure time.
Enhancement
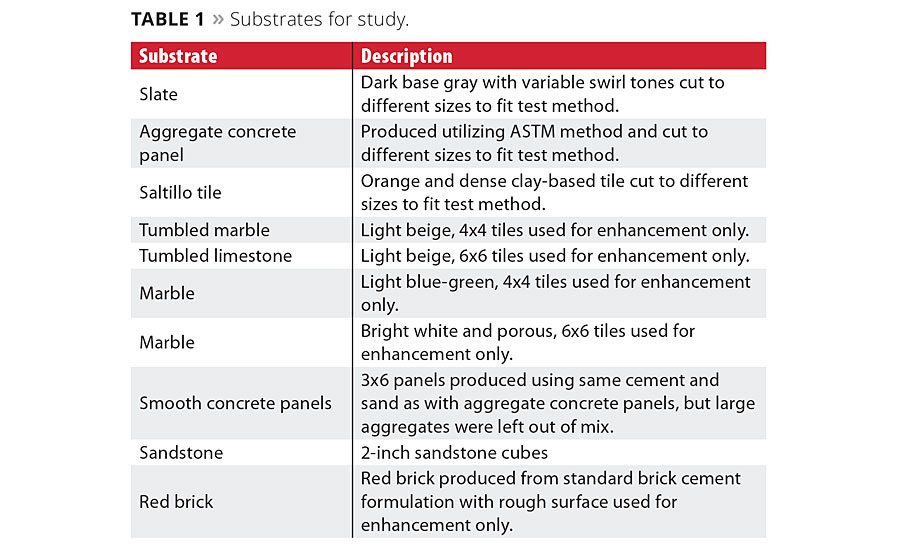
Table 1 shows a list of substrates included in this study. Templates were utilized to assure exact positioning of the colorimeter for repeatability of measurements. Color measurements were taken prior to applying the enhancing materials and after the enhancing materials were allowed to cure for a period of three days. The results were analyzed for absolute change in color values and percentage change in color values focusing on the L* or lightness value in the CIE L*a*b* color space.
Weathering
QUV and exterior exposure were used to evaluate weathering properties of the enhancing materials. Saltillo tile, slate and aggregate concrete panels were chosen to evaluate weathering properties. The templates were used to take pre-enhanced measurements, followed by post-enhanced and cured measurements. After initial color measurements, QUV measurements were taken in 250-h increments up to 2500 h, and exterior exposure measurements were taken at four and 12 months. QUV testing was cycled for 4 h at 50 °C, with condensation on and the lights off and for 8 h at 60 °C with condensation off and lights on using QUV-A bulbs.
Stain Repellency
The same three substrates used for weathering studies were also utilized for stain repellency testing. The test panels were all coated and allowed to cure for seven days prior to stain testing. Testing was similar to CTIOA-72 Field Report. The following staining agents were evaluated: ketchup, mustard, white wine vinegar, red wine, soy sauce, a cola soft drink, soya oil vegetable oil, coffee, water and a red cough syrup. The staining agents were allowed to reside on the substrates for 4 h. A household-grade spray cleanser was used with a sponge to clean the tiles after staining. The stains were each rated on a subjective scale of zero to four, with zero equaling no stain, and four equaling a very intense stain.
Weathered Stain Repellency
Saltillo tiles and aggregate concrete panels were used for both weathering studies and accelerated weathering stain repellency testing (on the QUV panels). Panels were removed and stain tested upon exposure at the following intervals: 250, 500, 1000 and 2000 h, with all of the values being compared to zero hours of exposure.
Abrasion Stain Repellency
Aggregate concrete panels were coated as previously described and allowed to cure for seven days prior to abrasion. The panels were abraded using a hog bristle brush on a Gardner linear abrasion machine using a modified version of ASTM D2486.8 Household-grade spray cleanser was diluted to 50% with water as a liquid cleaning agent. Initially, 50 mL of this solution were added to the panel, with 25 mL added at each 250-cycle increment. The panels were abraded for 2000 cycles. Only one half side of each coated face was abraded. The panels were allowed to dry for 24 h, and both the un-abraded and abraded sides were stain tested as previously described.
Analytical Testing
• EPA Method 24 VOC Testing;9
• FT-IR and FT-NMR for basic polymer characterization. The samples were prepared utilizing solvent extraction techniques as outlined by Smith.10
Equipment
• QUV – QUV – weather tester – Model QUV/Spray
• Colorimeter – BYK Spectro-Guide Sphere
• Settings: D65/10°
• FT-IR – Thermo Nicolet 6700 IR spectrophotomer
• FT-NMR – Bruker Avance II 400 spectrometer
• Karl Fischer – A Metrohm Karl Fischer titrator with a Metrohm Pt electrode
• Gardner linear abrader D10V
Samples Evaluated
All commercial materials were purchased and blindly evaluated. The descriptions in Table 2 are based on Technical Data Sheets and MSDS and if necessary, FT-IR and FT-NMR (H1, C13, F19 and Si29). Table 2 also shows the sample name (A-H) along with the basic chemistry of the product for performance comparison only.
Some reactive groups that leave during curing contribute to water-based materials having relatively low flash points. Generally, polysiloxane evolves alcohol groups (either methanol or ethanol). Some of the low-VOC materials also have relatively low flash points, which at first appears to be incongruous. Low-VOC materials may still contain flashing VOCs but do not show up based on VOC testing protocols. According to Mania et. al.,11 as materials become lower and lower in VOC, the errors associated with the specific component test methods become less accurate, leading to erroneous VOC results. The data for some of these zero-VOC materials had component test values that exhibited over 100% material with solid content and water combined. This is why a material that has zero tested VOC, may also exhibit a relatively low flash point such as sample E.
Results and Discussion
SILRES® BS 30 A is the primary focus of this article. For brevity it will be referred to as special functional siloxane (SFS).
Enhancement
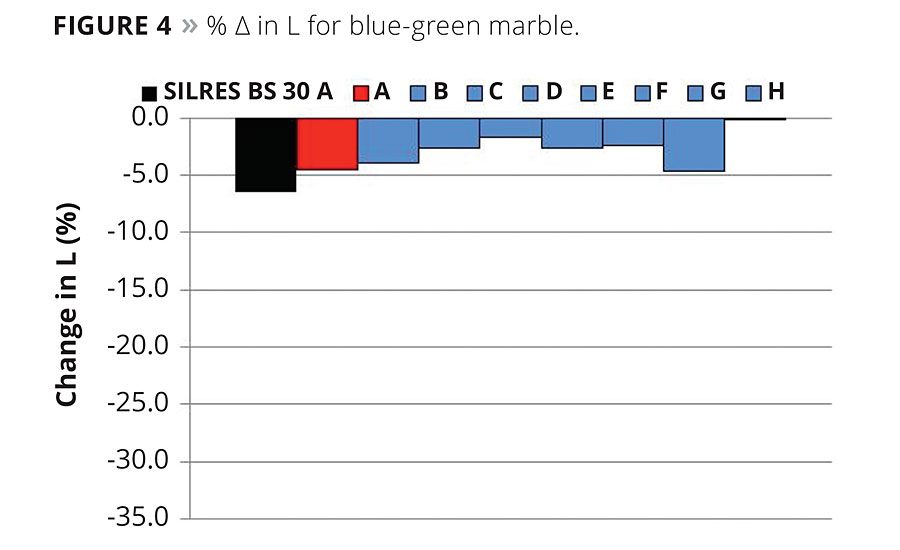
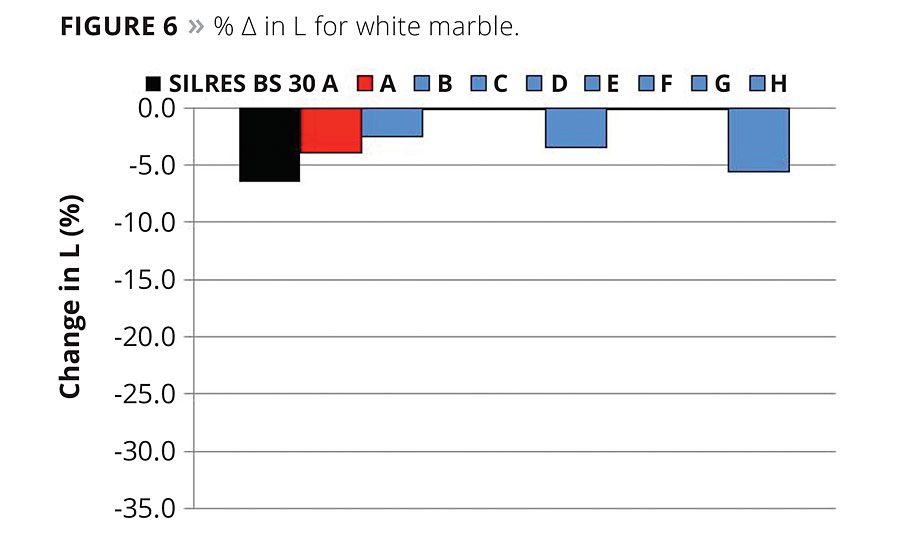
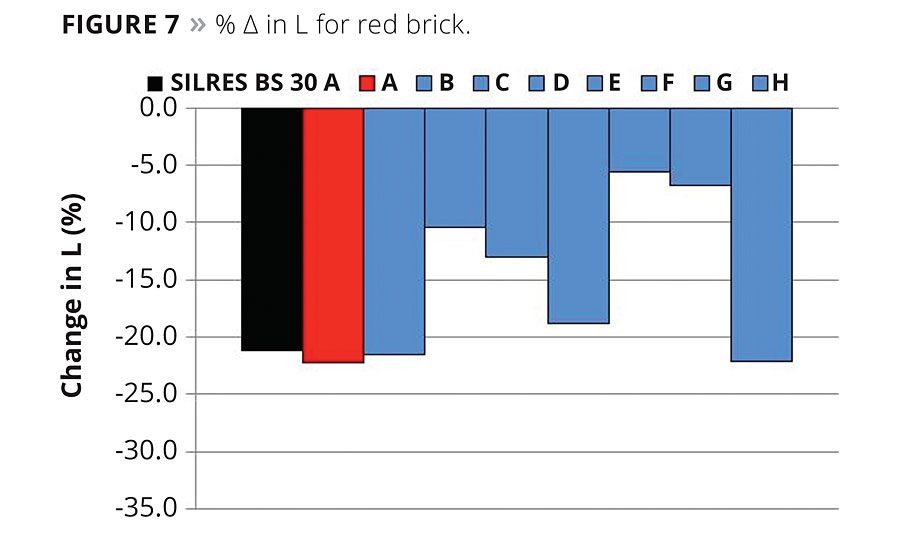
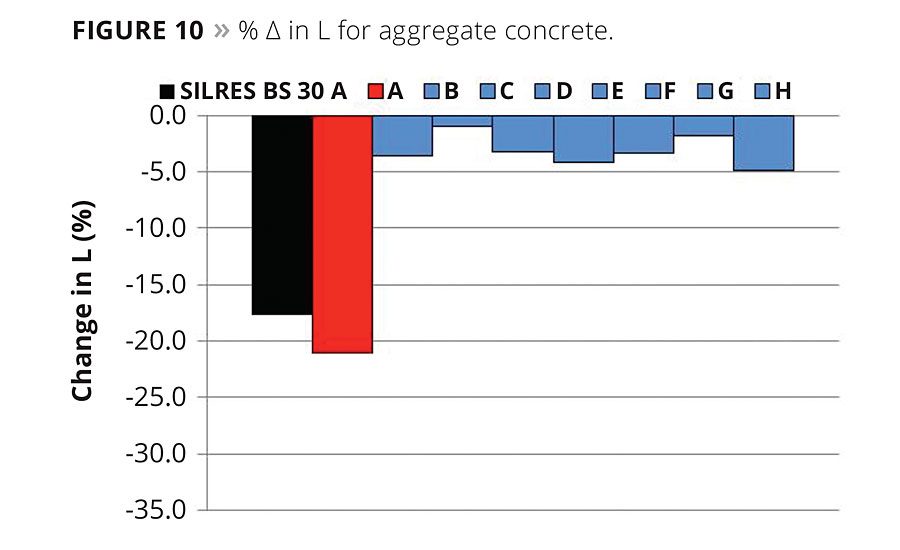
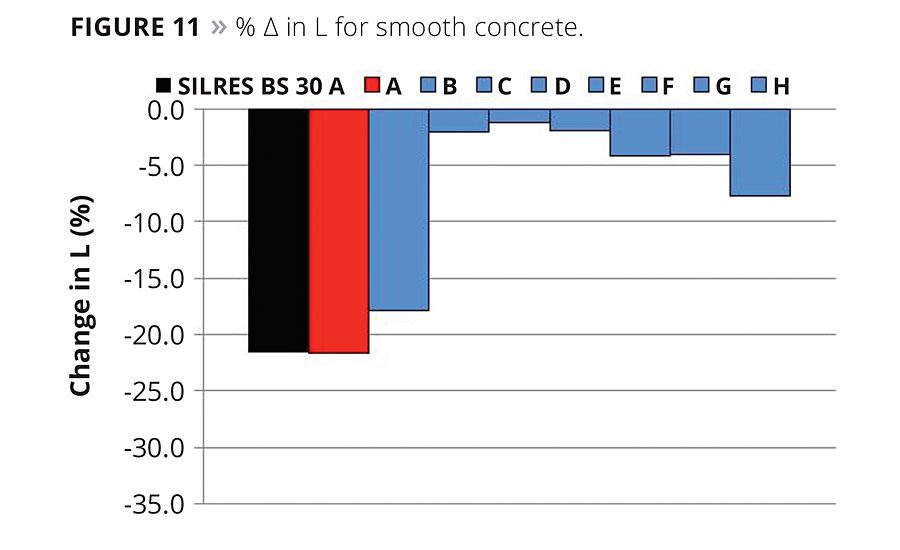
Solvent-based materials have historically provided the best overall attributes. Environmental concerns resulted in water-based material development. The solvent-based Sample A displays better initial overall enhancement than others tested. Some water-based products performed well over select subtrates. Over nearly all of the substrates SFS was the best at enhancing substrate attributes.
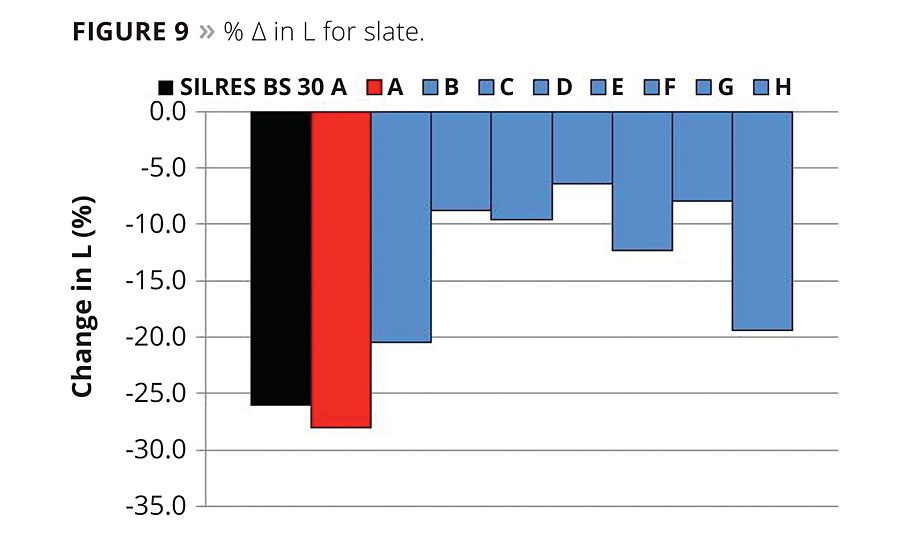
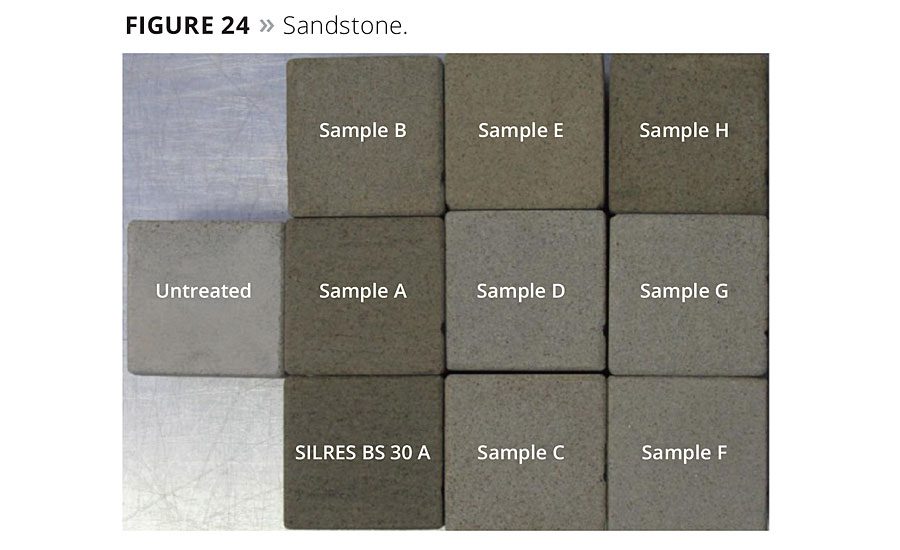
Substrate porosity may influence the enhancement properties of the materials, but the specific influence has not yet been established, is unpredictable and it is not the only influencing factor. Two examples: slate (Figure 9), a low-porosity material shows high enhancement; and highly porous sandstone (Figure 2) showing even greater enhancement.
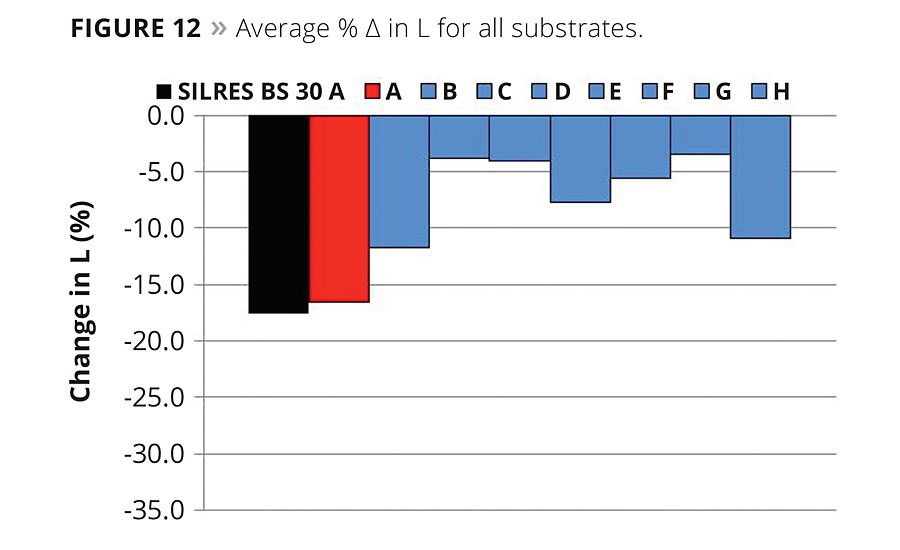
Figures 2 through 11 highlight the enhancement as a function of decreasing L* value. Figure 12 shows the average enhancement for all enhancers by substrate. SFS exhibits the greatest enhancement overall, followed closely by the solvent-based material.
Vegetable oil (Linseed and Tung) emulsions show the greatest enhancement of the water-based products even though they are only about a third of that of SFS and the solvent-based enhancers. These are followed closely by the acrylic/siloxane/flouropolymer blended material. Clearly the acrylic and EVA-based materials, which are all water-based, presumably emulsions, exhibit the least enhancement.
Weathering
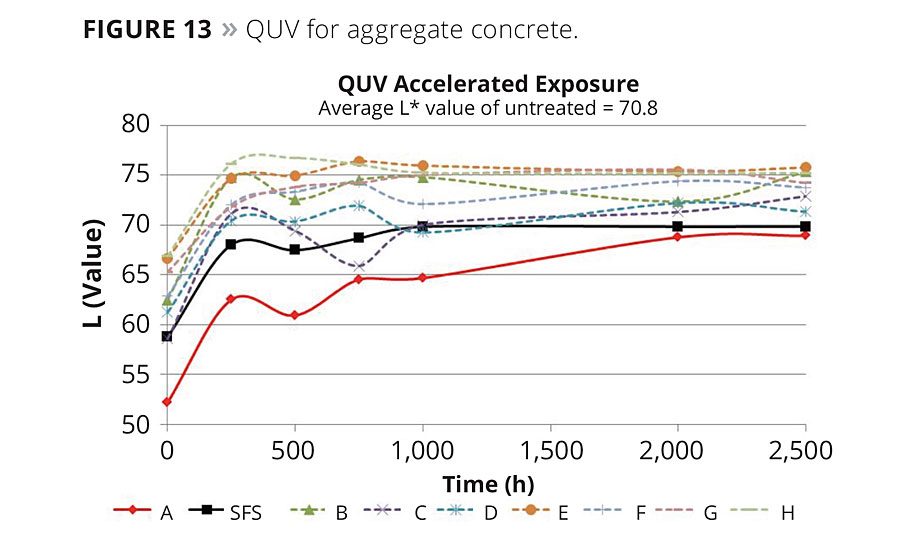
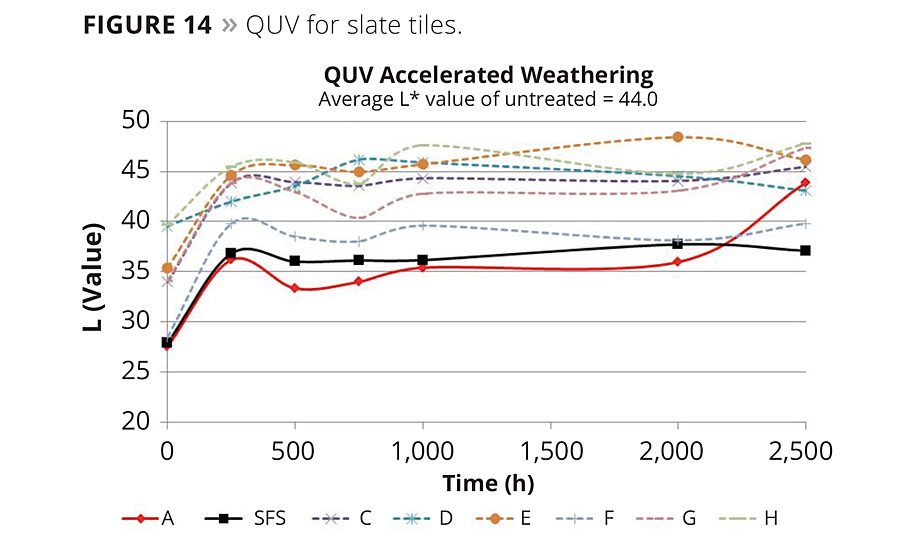
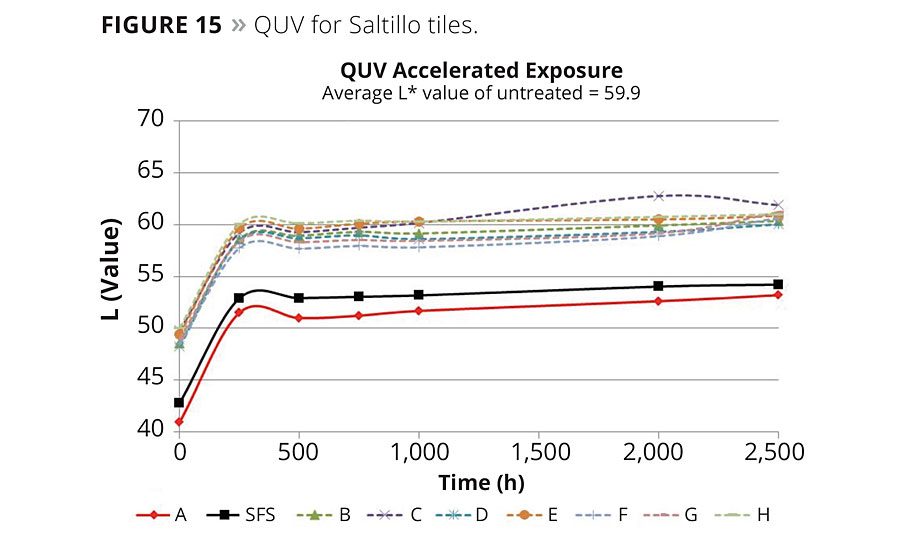
Figures 13-18 show the QUV results of the three tested substrates. For both aggregate concrete and Saltillo tile there appears to be little change after 250 h of accelerated weathering. The data as shown shows a similar trend in L* value versus time for aggregate concrete and Saltillo tile for all enhancers. However the magnitude of the change for the water-based materials is greater than SFS and the solvent-based products. Additionally, since all of the samples nearly stopped increasing in L* value after 250 h, the SFS still shows nearly 20% lower L* value than most water-based materials.
QUV of slate (Figure 14) shows a very interesting trend for the two vegetable oil enhancers. They originally displayed greater enhancement retention versus the other water-based products. Subsequently the L* value continued to increase while the other water-based products have leveled off.
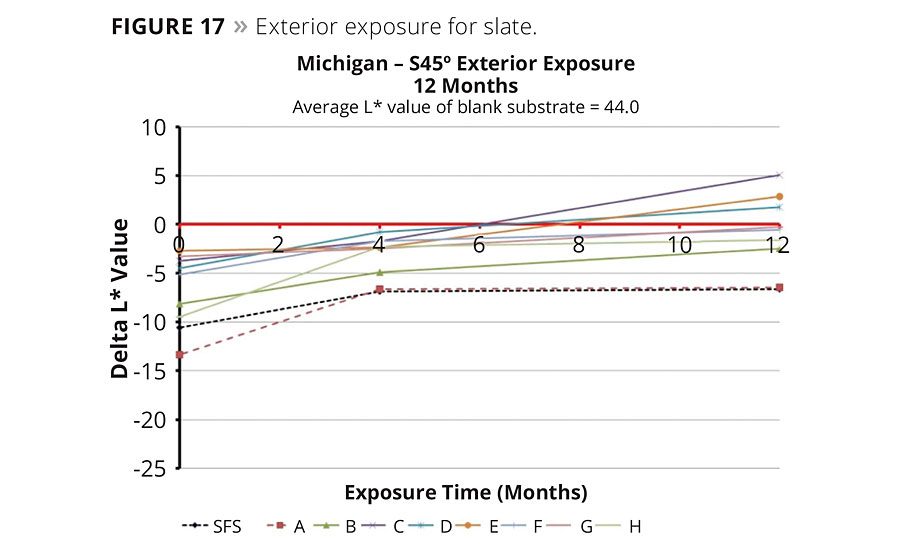
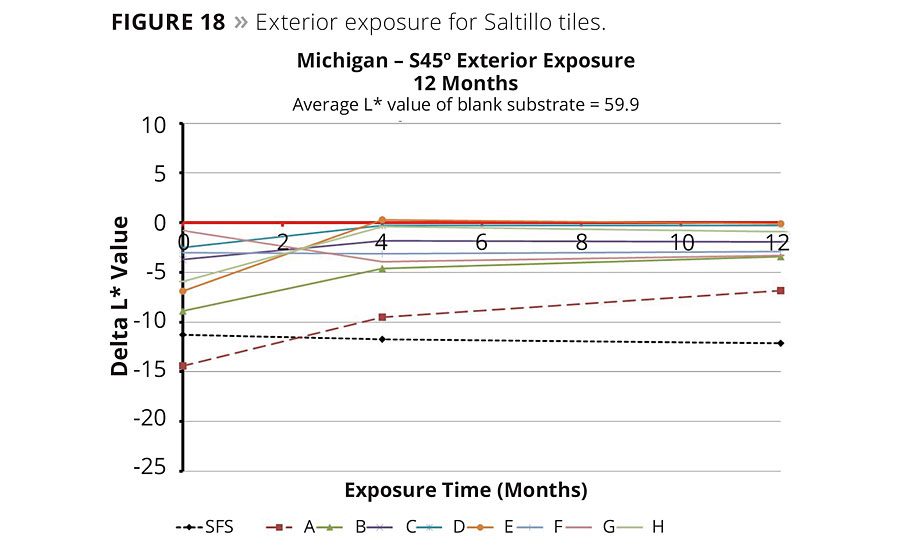
Michigan southern exposure samples have been on the test fence for 12 months. Readings were taken at one month, four months and 12 months. Overall the silicone-containing materials appear to be maintaining the greatest enhancement as of the publication of this study. Please note this data will continue to be collected for an indeterminate amount of time.
Figures 16-18 are charts for exterior exposure testing in real time. Please note that the slate tile with sample B fell off the exposure rack and was destroyed, so no exterior exposure data over slate can be reported for Sample B. Exterior exposure testing appears to correlate well with QUV in that both types of weathering show a significant increase in L* values (decreasing enhancement) during the early part of the testing. This occurred in the first 250 h with QUV and the first four months with exterior exposure. Aggregate concrete panels appear to have plateaued in the increase in L* values at four months of exterior exposure for most of the samples, whereas the L* values appear to still be increasing (losing enhancement) for some of the samples over both slate tiles and Saltillo tiles. The two polysiloxane samples (A and SFS) still maintain the best enhancement with exterior exposure. It is also interesting to note that the acrylic materials (samples C, D, F and G) and the oils (samples E and H) are still increasing in L* value at 12 months of exposure. In fact, several of the samples have L* values that are lighter than the original substrate, specifically samples C, D and E over slate tiles, and samples C, D, E, F and G over Saltillo tiles. The oil-containing samples (E and H) appear to be yellowing, while the acrylic-type-containing samples (C, D, F and G) appear to be chalking. The polysiloxane samples (A and SFS) are neither yellowing nor chalking. Overall the polysiloxane-containing materials maintain the greatest enhancement after the exposure testing.
Stain Repellency
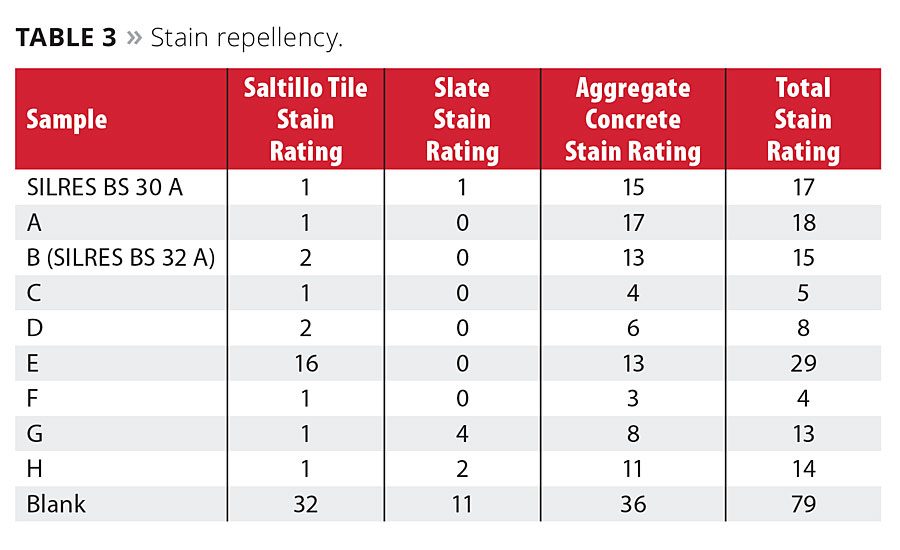
Table 3 shows the stain repellency data for each enhancer and substrate. The individual stain agent data is not shown but it is important to note that mustard, coffee, red wine and vegetable oil stained the most.
The three pure acrylic materials show the best initial stain repellency performance. This is believed to be because they form a film. This film is shown to degrade rather quickly upon UV exposure. The Linseed oil-based material displays the worst stain repellency performance. The incorporation of fluoropolymer into samples B and H does not appear to improve overall stain repellency. Concrete is the most difficult substrate to prevent staining with most of the enhancers, while slate posed the least problem.
Each of the various silicone-containing materials performed very similarly to each other and showed similar performance to the EVA and Tung oil-based enhancers.
Weathered Stain Repellency
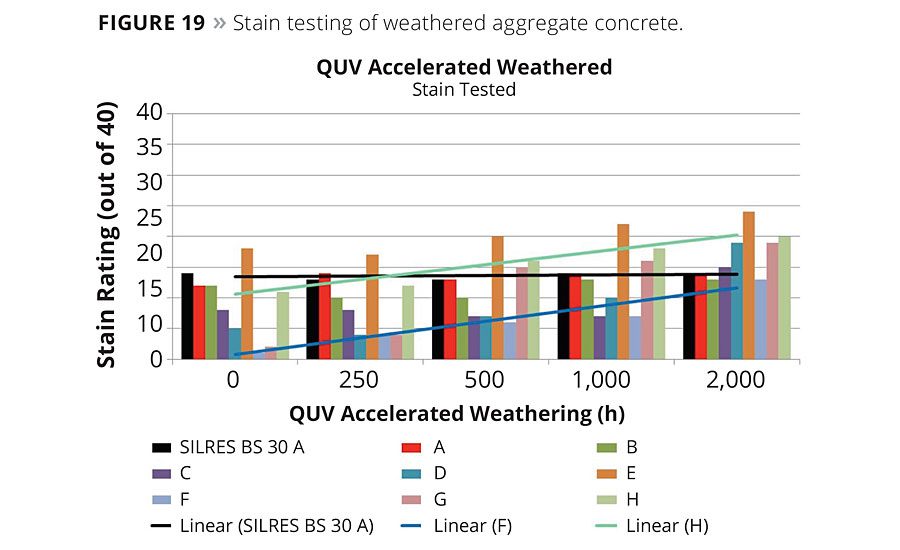
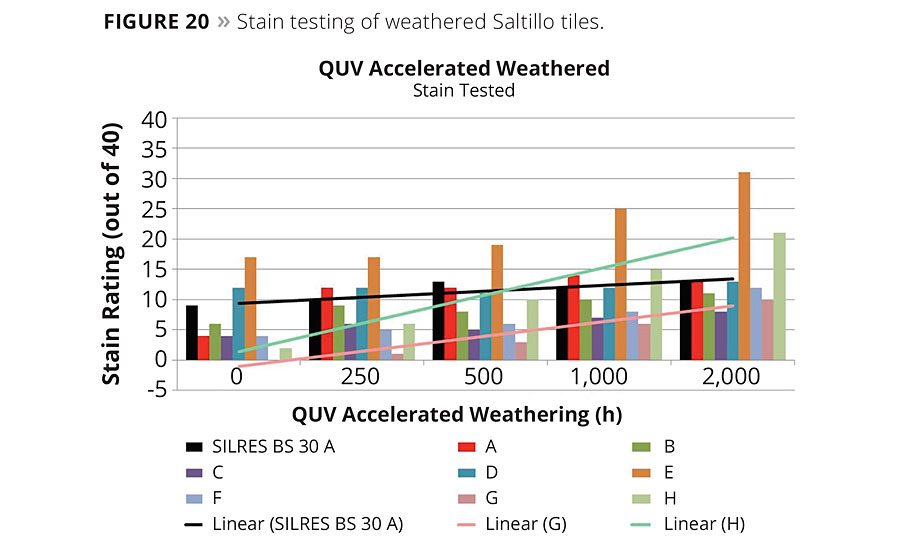
Slate tiles showed the best (or lowest) scores for stain repellency, as such, they were not used for accelerated weathering stain testing. Figures 19 and 20 show the stain repellency rating values for each sample grouped by QUV exposure time. Samples SFS, A and B maintain relative stable stain repellency performance versus exposure time.
Figure 19 shows the stain repellency data versus time over aggregate concrete panels. Three added trend lines show relative stain repellency performance over exposure time. Samples A, B and SFS are relatively flat (consistent stain repellency), while the remainder of the samples (including F and H trend lines) are trending up (less stain repellency). The Linseed oil (sample E) starts out with relatively poor stain repellency performance and continues to worsen upon exposure. The other materials starting with relatively good stain repellency performance all worsen over time. After 2000 h of QUV exposure the polysiloxane materials exhibit stable performance while the others worsen.
Figure 20 shows the trends for stain repellency versus time for Saltillo tile. The three added trend lines show relative stain repellency performance over exposure time. Stain repellency worsens over time for all Saltillo tiles. However, samples A, B, D and SFS all increase at a much reduced rate as compared to the other samples. Based upon the slopes of the trend-lines samples C, E, F, G and H all show an increase in staining (less stain repellency) rate by almost three times that of the increase in staining for samples A, B, D and SFS. After 2000 h of QUV exposure the polysiloxane materials exhibit stable performance while the others worsen.
Scrubbed Stain Repellency
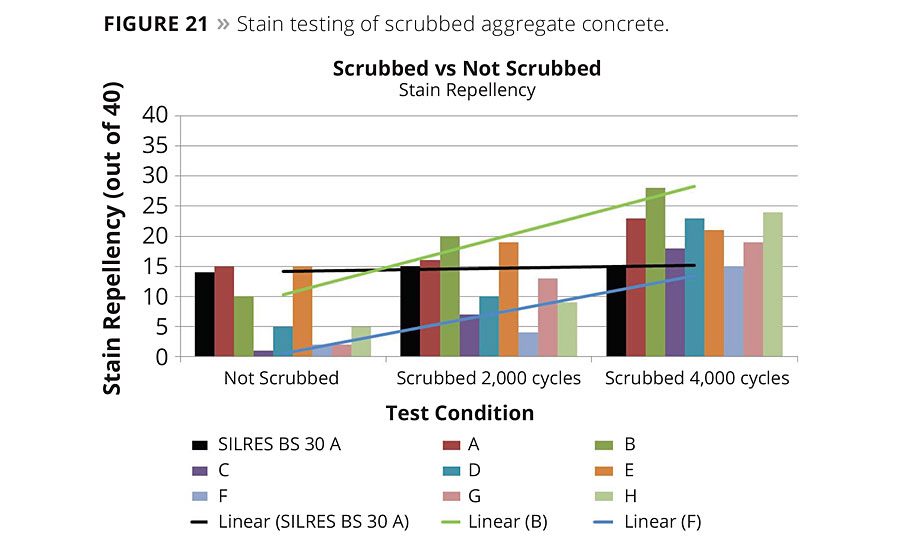
Saltillo tiles are clay based and relatively soft, so they were not used in scrub testing. The scrubbed, then stained data for aggregate concrete panels in Figure 21 is plotted for zero, 2000 and 4000 cycles. With the exception of the SFS sample, stain repellency worsens on all other materials after scrubbing. Two of the trend bars give examples of this worsening phenomenon. Even the high-VOC (solvent-based) material shows worse stain repellency with increased scrubbing. This highlights the fact that film-forming materials (acrylics and EVA) may have superior initial stain repellency. However they do not wear as well, thus losing their early effective stain repellency. Conversely, the SFS material actually penetrates and reacts with the substrate and maintains the same performance with scrubbing.
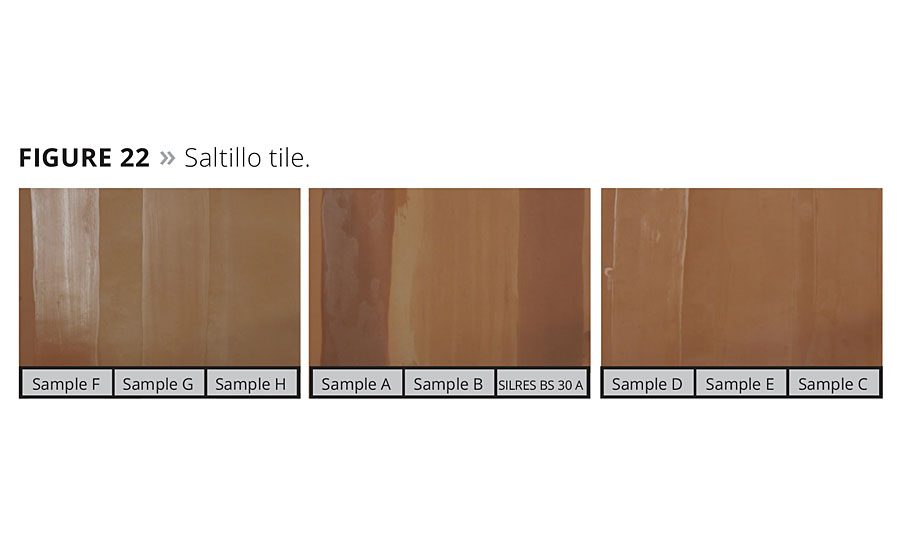
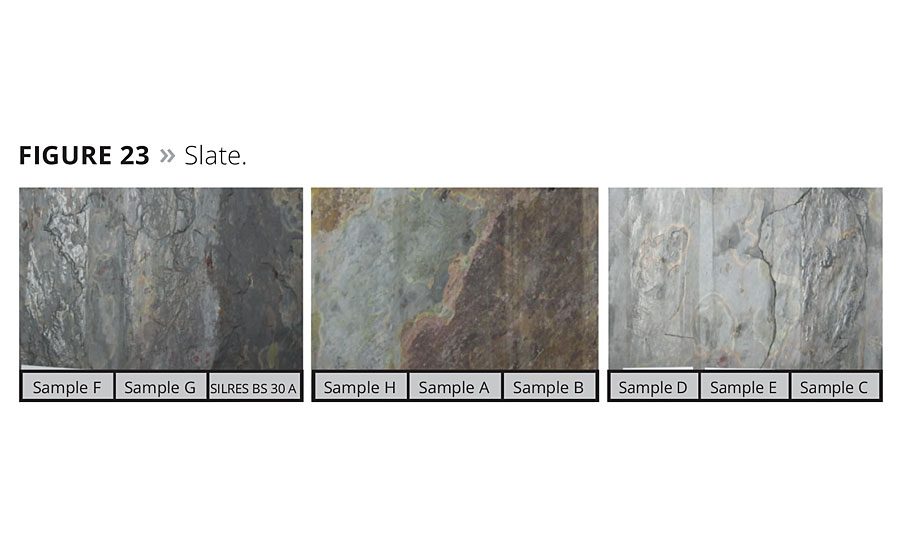
Photographic Examples
Figures 22 and 23 show two sets of the exterior exposure panels - one for Saltillo and one for slate tiles. The tiles are 12 inches square. Three enhancers in approximately three-inch widths were applied to each tile. The spaces in between are uncoated. Note that the SFS (SILRES BS 30 A) and sample A exhibit the strongest enhancement over Saltillo tile. Over slate the enhancement with SFS (SILRES BS 30 A) enriches the natural beauty of the substrate. Please note these photos were taken after only four months of exterior exposure.
Figure 24 displays samples of each enhancing product applied to sandstone. Note the superior enhancement of the SFS (SILRES BS 30 A) and samples A, B and H over the acrylic and EVA materials (samples C, D, G and F).
Conclusions
The goal of this article is to highlight the performance advantages of the unique structure of neat siloxane chemistry as a surface-enhancing material, specifically with respect to enhancement, weatherability and stain repellency.
• The acrylic materials displayed good initial stain repellency, but provided less initial enhancement. Stain repellency suffered (at a greater rate) upon weathering and scrubbing.
• Vegetable oil performance: Tung oil exhibits better stain repellency than Linseed oil. Both suffered upon exposure and scrubbing. The data suggests that this trend will continue.
• Polysiloxanes displayed the best initial enhancement and best enhancement retention. Although the polysiloxanes were not the best for initial stain repellency, their attributes became evident upon exposure and scrubbing.
• Weatherability and scrub performance of the SFS material was equal to or better than other tested products. It is the best at maintaining stain repellency and enhancement properties of the products tested.
Acknowledgements
Many people have supported this project to date. I would like to acknowledge their contributions, not in any particular order: Diana Omycinski, Steve Ross, Chris Reeves, Roland Ruan and Bernie Rickard, for all of their analytical work. I would also like to thank the co-developers of this product, Dr. Hartmut Ackermann, Mike Coffey and Richard Kirkpatrick. I would also like to thank Mark Westfall for helping to combine two papers into one for this publication. Lastly, but certainly not least, I would like to thank Erica Vera, Rick Coffey and Lucas Madison for their help with the accelerated weathering, abrasion testing and stain repellency testing. Without their support much of this work would not have been able to be completed in a timely fashion.
References
1 Hall, J. “Novel Waterborne Technology for Wet Look Sealers”, Reichhold, presented at 2012 Coatings for Concrete ACS Show in Las Vegas, Nevada.
2 Presentation by X-rite Corporation, entitled “A Guide to Understanding Color Communication,” Grand Rapids, MI (2007).
3 Mania, D.J. New, Low-VOC, Enhancing Polysiloxane Technology, 41st Annual Waterborne, High-Solids and Powder Coating Conference (2013), New Orleans, LA, University of Southern Mississippi, Hattiesburg, MS.
4 Mania, D.J., from the 42nd Annual Waterborne, High-Solids and Powder Coating Conference (2014), New Orleans, LA, University of Southern Mississippi, Hattiesburg, MS. February 2014.
5 Ackermann, H.; Mania, D.J.; Kirkpatrick, R.L.; Coffey, M. Non-Yellowing, Low-VOC Mineral Surface Enhancer, US Patent – US 8,470,949 B2, June 25, 2013.
6 ASTM G 154 – 12a: Standard Practice for Operating Fluorescent Ultraviolet (UV) Lamp Apparatus for Exposure of Non Metallic Materials, Volume 14.04.
7 CTIOA Field Report T-72 (R-02), Stain Repellency Test Method, http://www.ctioa.org, Ceramic Tile Institute of America.
8 ASTM D 2486 – 06: Standard Test Methods for Scrub Resistance of Wall Paints, Volume 6.02.
9 Brezinski, J.J. Manual on Determination of Volatile Organic Compound (VOC) Content in Paints, Inks, and Related Coating Products: Second Edition, ASTM, Philadelphia, PA, 1993.
10 Smith, A.L. The Analytical Chemistry of Silicones, Wiley, New York, 1991.
11 Mania, D.J.; Bruck, M.L.; Fezzey, S.; Floyd, F.L. Sources of Error in VOC Determination Via EPA Method 24, Journal of Coatings Technology, August 2001, Vol. 73, Issue 919, pg. 111-117.
Looking for a reprint of this article?
From high-res PDFs to custom plaques, order your copy today!


