A Methodology for Optimizing Chromate Conversion Coating Process Parameters
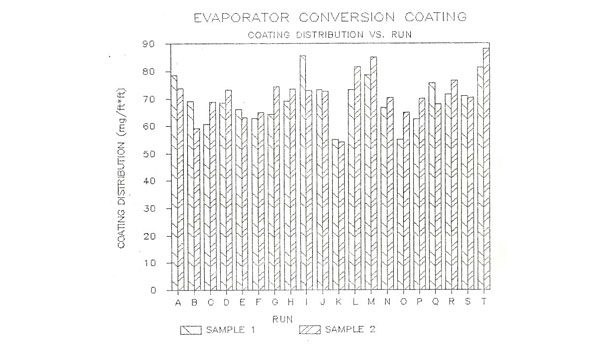
FIGURE 1 | Chromate coating weight distribution measured in production run.

FIGURE 2 | Cleaner concentration.
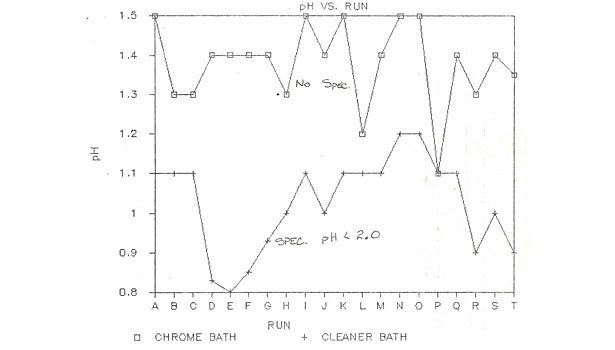
FIGURE 3 | Cleaner and chrome bath pH.
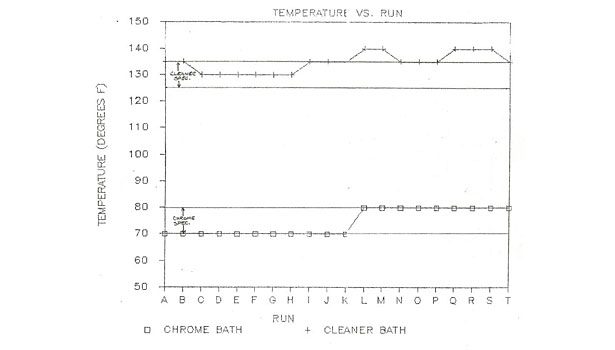
FIGURE 4 | Temperature of the cleaner bath and the chrome bath

FIGURE 5 | Chrome concentration.

FIGURE 6 | Aluminum ion concentration in the cleaner and the chrome bath.

FIGURE 7 | Fluoride ion concentration in the cleaner and the chrome bath.

FIGURE 8 | Calculated coating weight as a function of chrome bath pH.

FIGURE 9 | Calculated coating weight as a function of cleaner concentration.

FIGURE 10 | Calculated coating weight as a function of cleaner bath pH.

FIGURE 11 | Calculated coating weight as a function of the chrome bath pH.

FIGURE 12 | Calculated coating weight as a function of cleaner concentration.

FIGURE 13 | Polarization results for uncoated and coated aluminum braze clad coupon in ASTM water.

FIGURE 14 | Pitting and open circuit potential as a function of coating weight for aluminum braze-clad coupon. A complete separation between Ep and Eoc is observed beyond a coating weight of 40 mg/sq. ft.

FIGURE 15 | Pitting and open circuit potential as a function of coating drying temperature. A complete separation between Ep and Eoc is obtained at all drying temperatures.

FIGURE 16 | Surface characteristics of aluminum braze clad coupon coated at 40 mg/sq. ft. and dried at 225 °F. At 200X

FIGURE 16 | Surface characteristics of aluminum braze clad coupon coated at 40 mg/sq. ft. and dried at 225 °F. At 800X

FIGURE 17 | Surface characteristics of aluminum braze clad coupon coated at 160 mg/sq. ft. and dried at 225 °F. Note the powdered form of coating. At 800X

FIGURE 17 | Surface characteristics of aluminum braze clad coupon coated at 160 mg/sq. ft. and dried at 225 °F. Note the powdered form of coating. At 200X

FIGURE 18 | Surface characteristics of aluminum braze clad coupon coated at 80 mg/sq. ft. and dried at 230 °F. At 200X

FIGURE 18 | Surface characteristics of aluminum braze clad coupon coated at 80 mg/sq. ft. and dried at 230 °F. At 800X

FIGURE 19 | Surface characteristics of aluminum braze clad coupon coated at 80 mg/sq. ft. and dried at 310 °F. At 200X

FIGURE 19 | Surface characteristics of aluminum braze clad coupon coated at 80 mg/sq. ft. and dried at 310 °F. At 800X


An in-depth study was undertaken to correlate chromate conversion coating process variables to coating weights obtained on aluminum braze sheet coupons. The purpose of this study was (1) to determine the target coating weight (mg/sq. ft.) that was required for adequate corrosion protection; (2) to correlate conversion coating process variables to coating weights on aluminum braze sheet coupons; and (3) to find the optimum process conditions that will achieve target coating weight.
Rigorous statistical analysis was conducted to correlate the process parameters to coating weight. Polarization tests were conducted whereby open circuit potential and pitting potential were compared to determine the minimum coating weight needed to achieve corrosion protection.
Experimental
Aluminum braze sheet coupons consisting of 3005 core alloy with 4047 braze alloy clad on both sides were run through a vacuum braze cycle to create a production-typical surface. These coupons were then run through a production conversion coating bath over a period of time to measure the coating weight each coupon acquired from the process. Two coupons (approximately 3" x 6" each) were singularly hung in each run through the coating baths.
Coating weights were determined using the wet method. In this method a coupon is carried through the conversion coating baths and allowed to air dry for 30 min. Next, the coupon is weighed and dipped into a 50% by volume solution of nitric acid for 60 sec. The coupon is then removed and the remaining chromate coating is wiped free using a cotton cloth and rinsed with de-ionized water. The coupon is reweighed after being air dried for 30 min. The difference in the two weights divided by the coupon’s surface area results in the coating weight measured in mg/sq. ft.
For corrosion testing, the coupons were vacuum braze cycled and coated under controlled laboratory conditions, but simulating the production process. Two sets of panels were coated. One set was used to examine the influence of coating weight on pitting potential. Different coating weights were achieved by varying the immersion time in the chromate solution (15 sec for 40 mg/sq. ft.; 30 sec for 80 mg/sq. ft.; and so on). Panels with coating weights of 40, 60, 80, 100, 120 and 160 mg/sq. ft. were prepared by this procedure and dried at 225 °F. The second set of panels was prepared using the same procedure except that they all had a coating weight of 80 mg/sq. ft. and were dried at temperatures from 190 °F to 310 °F in increments of 20 °F.
Polarization experiments were conducted on coupons prepared from these panels. In this technique, the specimen’s potential is varied using an external electrical circuit, and the specimen’s current response is measured. This technique measures the open circuit potential and the pitting potential, and these two measurements have been used in this study to judge the coating’s protectiveness. The tests were conducted in ASTM water, containing 100 ppm each of chloride, sulfate and bicarbonate, at room temperature; potentials were measured with reference to a saturated calomel electrode.
Production Process Optimization Results
Twenty runs of two coupons were made during this study with an average coating weight of 70.8 mg/sq. ft. and a range in coating weight from 55 to 85 mg/sq. ft. The results of these runs are presented in Figure 1. The results also show a 5 to 10 mg/sq. ft. variation in coating weight between the two samples. This variation may be attributed to the difference in the coupons’ surface condition (dirt, surface topography etc.).
During each of the 20 runs, samples were taken for analysis from the cleaner and chrome baths. The cleaner bath was checked for aluminum, fluoride, and hydrogen ions and cleaner concentration. The chrome bath was checked for aluminum, fluoride, and hydrogen ions, and hexavalent and trivalent chrome content. The temperature of both baths was monitored during each run. Of all the variables measured, only the cleaner concentration, cleaner pH, bath temperature and hexavalent chrome concentration are measured by the plant during production runs. These are the only process parameters with defined specifications.
Variation in the cleaner concentration during each run can be seen in Figure 2. Here the specification calls for a concentration of 3.14 to 4.26% cleaner by volume. In several instances the concentration fell below its minimum limit. The pH of the cleaner and chrome baths during this study is recorded in Figure 3. Cleaner pH is required to be below 2.0, which it was in every sample of the study. The chrome bath pH is also shown, but it has no defined specifications. Suggested temperature of the cleaner bath is between 125 and 135 °F. In several instances this bath temperature extends to 140 °F. The chrome bath temperature lies within its 70 to 80 °F specification throughout the study. These temperatures are illustrated in Figure 4. The chrome concentrations during each run can be seen in Figure 5. The hexavalent chrome concentration is well within its 400 to 1200 ppm limits. The trivalent chrome concentration was found by analyzing for the total chrome concentration and subtracting the hexavalent chrome concentration. Currently, there is no set specification for this species of chrome.
Aluminum and fluoride ion concentrations of both baths were also monitored during the study. There is no required concentration limits for these ions. However, they were analyzed to observe their variation from run to run depending on volume of product going through the baths and how often the bath is regenerated. These concentrations can be seen in Figures 6 and 7. There are indications in the literature1 that aluminum concentration greater than 300 ppm in the chrome bath reduces the coating weight. The aluminum concentration in the bath in this study ranged from 400 to 500 ppm.
Several attempts were made at a statistical regression analysis of the data collected. The first attempt included a hyper-planar relation of all the parameters analyzed in the study to the coating weight of the coupons. However, a correlation factor of only 18% was achieved. By eliminating variables that appeared to have a low contribution (based on the magnitude of the coefficients) to the overall coating weight, a correlation factor of 25% was achieved. This regression related the cleaner bath concentration, temperature and pH, and the chrome bath trivalent chrome concentration, temperature and pH to the coating weight of the coupons.
In order to further refine the regression, a parabolic relation was introduced to the most significant contributor to the coating weight of the previous regression, namely the pH of the cleaner bath. This raised the correlation to 26%. The parabolic relation was expanded to the pH of the chrome bath and to the cleaner concentration. The equation relating the coating weights to remaining process variables is as follows:
X = -131.992 A2 + 359.940 A - 25.887 B2 + 357.129 B + 2.635 C2 – 17.643 C + 0.8099 D + 0.067042 E + 0.0588 F – 229.250
Where,
Coating weight (mg/sq. ft.) = X
pH chrome bath = A
pH cleaner bath = B
Cleaner concentration = C
Chrome bath temperature = D
Cleaner bath temperature = E
Trivalent chrome concentration = F
Each constant that multiplies a specific parameter of the equation has a certain confidence value. These values were determined using a statistical “F-test”. The results of the F-test show what percentage of event sets could randomly occur with the given correlation. For example, an F-test value of 0.001 means that 0.1% would occur randomly in this fashion. This would suggest extremely reliable data.
The F-test values for the constants are:
For A2: 0.001
For A: 0.001
For C2: 0.25
For C: 0.1
The rest of the variables have become insignificant.
The relation of the chrome bath pH to the coating weight (with all other variables held fixed at their average value during the study) is shown in Figure 8. During the study the chrome bath pH operated between a pH of 1.1 and 1.5. This regression shows that low coating weights will occur at this pH and that maximum coating weights can be attained at an extrapolated pH of 2.7.
The relation of the cleaner concentration and the calculated coating weights can be seen in Figure 9. Here the cleaner concentration varied from 1.0 to 4.0% by volume during the study, and is specified to run between 3.14 and 4.26% by volume cleaner. This figure shows that a lower cleaner concentration is beneficial to the coating weight.
This regression was further refined by eliminating outlying data points. These points had a calculated coating weight of +/- 10 mg/sq. ft. different from the actual coating weight. The resulting regression obtained a 35% correlation and improved some of the F-test values. The regression equation and the F-test values are shown below:
X = -202.920 A2 + 540.300 A + 54.022 B2 - 112.920 B + 1.871 C2 – 14.587 C + 0.6795 D + 0.09812 E + 0.0672 F – 270.31
F-test Values:
A2: 0.001
A: 0.001
B2: 0.05
B: 0.05
C: 0.1
The rest of the coefficients become insignificant. Note that the pH of the cleaner has become significant while the constant coefficient for the cleaner concentration squared has dropped out.
The effect of the cleaner’s pH on the calculated coating weight can be seen in Figure 10. It shows that a lower cleaner bath pH will enhance a coating. The relation between the chrome bath pH and the calculated coating weight is shown in Figure 11. Once again a higher pH for the coating bath than what the process is operating at is desired. The cleaner concentration effect on the coating weight is shown in Figure 12. This relation has also not changed much from the previous regression; a lower concentration will enhance the coating. In each figure the operating ranges and specifications are included for clarity.
By examining the generalizations that are repeated in each regression of the data, one observes consistently that a higher chrome bath pH than what is currently being run in production (approximately 2.7) will maximize the coating weight that the product will acquire. This prediction is agreeable from a theoretical standpoint since a higher pH prevents the reduction of hexavalent chrome to trivalent chrome (hexavalent chrome provides a more protective coating than trivalent chrome).
The data also suggests (in the final regression) that a lower pH of the cleaner bath is desirable. The process operated between 0.8 and 1.2 during the study. However, the statistical estimate of a maximizing cleaner pH is well within the specification defined for the process (spec: pH<2.0). Since a low pH is within process specification, this condition could easily be attempted in the plant.
The final regression also indicated that a lower cleaner concentration was beneficial to a higher coating weight. Figure 9 suggests that no cleaner results in the best coating. Obviously that is a mathematical anomaly to a physical process and would require that we put limits to the applicability of this correlation. This correlation suggests, in practical terms, that less cleaner is beneficial from the data range of 1.0 to 4.0% by volume cleaner. Cleaner is believed to be necessary to prepare the aluminum surface to receive the chromate coating. Excess cleaner may be being carried over into the cleaner rinse tanks and eventually into the chrome tank. This may cause the chrome coating to be dissolved away as it is forming on the aluminum surface. This situation could be alleviated by increasing the overflow rates of the rinse tank, thus decreasing the concentration of the cleaner in all the tanks (a situation that will not detract from the coating process; therefore, it could conceivably be tested in production without harming the product). A better confirmation may be to test it under laboratory conditions because a lower concentration recommended by this study is outside of the process specification. It is worth noting that increasing the overflow rates as well as the use of higher cleaner concentration increases the cost of the process as well as affluent discharge to the environment.
There is an obvious contradiction in the two variables of the previous paragraphs. For the cleaner bath, the regression analysis suggests that the cleaner pH as well as the cleaner concentration be lowered. Since it is an acid cleaner, lowering the cleaner concentration will automatically increase the pH. Contradictions such as this question the validity of the analysis to a certain degree. In addition, some of the predictions are so far removed from the actual specification that that such gross extrapolation seems to be unreasonable. Nonetheless, the analysis is presented to suggest a need for a controlled laboratory study of the coating process as well as suggest a methodology to study a production coating process.
Removing the outliers may not make the conclusions more true. It only suggests that either more accuracy or more degrees of freedom are needed. Therefore, it could be equally likely that the hyperbolic regression (not shown in the article) which aid that a higher cleaner pH is beneficial could be equally true. In any event there is no conflict in the two analyses with regard to the chrome bath pH or the cleaner concentration effects.
Corrosion Results
Figure 13 presents the polarization behavior of one bare (uncoated) sample and two samples coated at 40 mg/sq. ft. The open circuit potential (Eoc) represents the potential of the coupon in an immersed condition where the rate of the cathodic reaction is equal to the rate of the anodic reaction. The net current is, therefore, zero at this potential. This state is represented by Eoc for Test #14 in Figure 13. When the coupon’s potential is polarized in the anodic direction using the external electrical circuit, the current initially increases with increasing potential, indicating increased corrosion activity on the coupon. As Test #14 shows, the current becomes almost constant beyond a certain potential. This constant current region indicates a state of passivity on the coupon’s surface. When the potential is increased further, a point is reached when the current is no longer constant and a sharp increase in current is observed. This potential is referred to as the pitting potential and represents a condition where the protective surface layer is no longer protective, and pitting (localized corrosion) is expected to occur beyond this point (since current density is a measure of the rate of corrosion, an increase in current density represents a situation where accelerated corrosion can be expected). This point is represented by Ep in Figure 13. When Ep and Eoc are separated as in Test #14, one can expect to have corrosion protection from the coating. This is how the coating’s protectiveness is inferred. It may be noted that Test #9 (that had the same coating weight) did not show such separation, suggesting that a 40 mg/sq. ft. coating weight may not be sufficient to provide protection due to variability in coating uniformity. The uncoated panel shows no passivation range and, therefore, no pitting potential. In this case pitting is expected to begin immediately as indicated by increasing current density with increasing potential.
Figure 14 presents the open circuit and pitting potentials measured on coupons with various coating weights. The scatter in the data is apparent. There is significant overlap in the potential values measured for coupons with various coating weights. A statistical comparison of these measurements across coating weights showed no significant change from one coating weight to the next. If additional data were generated, maybe discernible differences could be obtained. But one can draw some engineering conclusions from this data. For the coupons coated with 40 mg/sq. ft., one coupon out of three showed no separation between Eoc and Ep. So if we targeted the actual product in production to have this level of coating weight, there would be a significant chance that it would pit under service conditions. On the other hand, coating weights beyond this level always showed separation between Eoc and Ep even under the worst situation, which is defined by the lowest pitting potential and highest open circuit potential measured using multiple coupons (that is Eoc and Ep have least separation in multiple tests). So the production target has to be beyond this coating weight. Very large coating weights are to be avoided based on cost consideration and also from the standpoint that powdery coating is obtained at very high coating weights. So the logical recommendation to manufacturing was to target for 80 mg/sq. ft. with variations of 15 mg/sq. ft. on either side. This recommendation has been adopted in manufacturing and is being used as a process control parameter rather than a specification at this point. It should be emphasized that this recommendation is unique to this process using vacuum brazing and the chemicals that are used for surface cleaning and chrome coating. A Controlled Atmosphere Brazed (CAB) aluminum braze sheet will require a very different set of process parameters and maybe even different cleaner and chrome bath chemicals to obtain optimum coating weights. The target optimum coating weight could be different as well.
Similar data for the drying temperature are presented in Figure 15. Again, a significant scatter is obtained in the data. But no overlap in Eoc and Ep is obtained at any of the drying temperatures included in this study, suggesting that it may be acceptable to dry the coating at such high temperatures as 310 °F (this again is based on the worst case basis where Eoc and Ep are least separated). It is, however, generally believed that higher temperatures reduce the coating’s protective quality, and in this regard time at temperature may be an important consideration. The military standard2 recommends a drying temperature (and the service exposure temperature) not to exceed 140 °F. From a production standpoint this is considered to be an impractical drying temperature because of the long cycle time of the process. A practical approach may be to strive to lower the drying temperature from 225 °F by improving the furnace air circulation (dry air as compared to moisture laden air). The data here seems to suggest that coating weight may be a more important parameter than the drying temperature.
The observations made here are further supported by scanning electron microscope examination of the surface of the coupons. Figures 16 through 19 show the micrographs for samples coated with various coating weights and dried at different temperatures. It is apparent that increasing the coating weight from 40 to 160 mg/sq. ft. (for a drying temperature of 225 °F), makes the coating powdery. Drying temperature seems to have no influence on the surface characteristics of the coating. It is possible that the form of chromium (Cr+3 versus Cr+6) on the surface is altered by the temperature. That has not been studied in this research.
Conclusions
Rigorous statistical analysis tools have been presented to optimize chromate conversion coating parameters for the coating of an aluminum braze clad alloy. Optimization is necessary to obtain a uniform coating, minimize cost and minimize affluent discharge into the environment. Polarization technique seems to be a viable tool to measure corrosion protection afforded by the coating. For the process discussed here, it seems that 80 mg/sq. ft. is an optimum coating weight for corrosion protection. Scanning electron microscopy showed that high coating weights would make the coating powdery. While drying temperature did not seem to be a primary variable of importance in this study, an intermediate temperature for drying (225 °F) was continued based on supplier recommendation, the literature and process cycle time considerations.
References
- Arrowsmith, D.J. et al., Trans. Inst. of Metal Finishing, 1985, Vol. 63, No. 3/4.
- Chemical Conversion Coatings on Aluminum and Aluminum Alloys, MIL-DTL-5541F, July 2006.
For more information, email rrungta@eximpglobal.com.
Looking for a reprint of this article?
From high-res PDFs to custom plaques, order your copy today!


